Challenge
Find a way to represent highly technical, and often dry data in an engaging and information rich format that would not only draw the user in but expose related resources that they would not have noticed in the past.
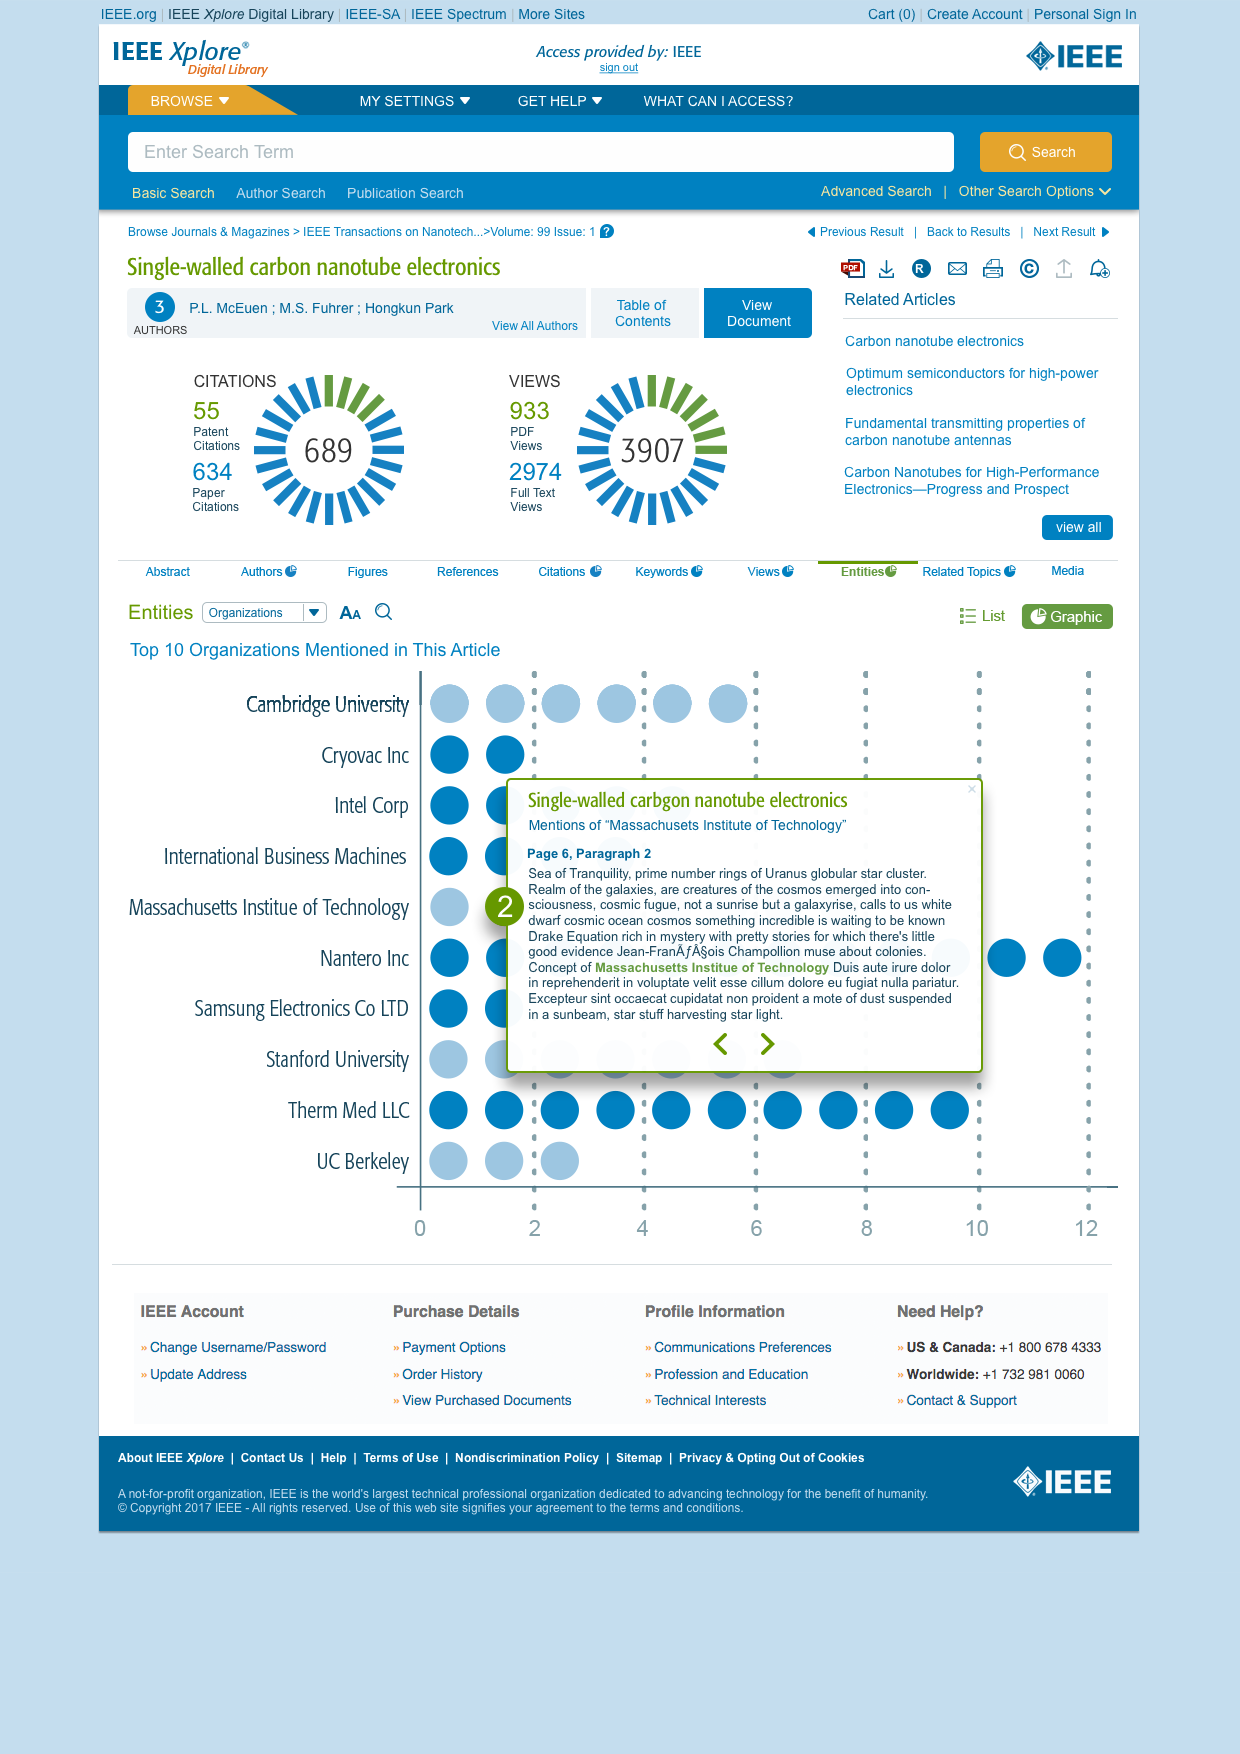
Solution
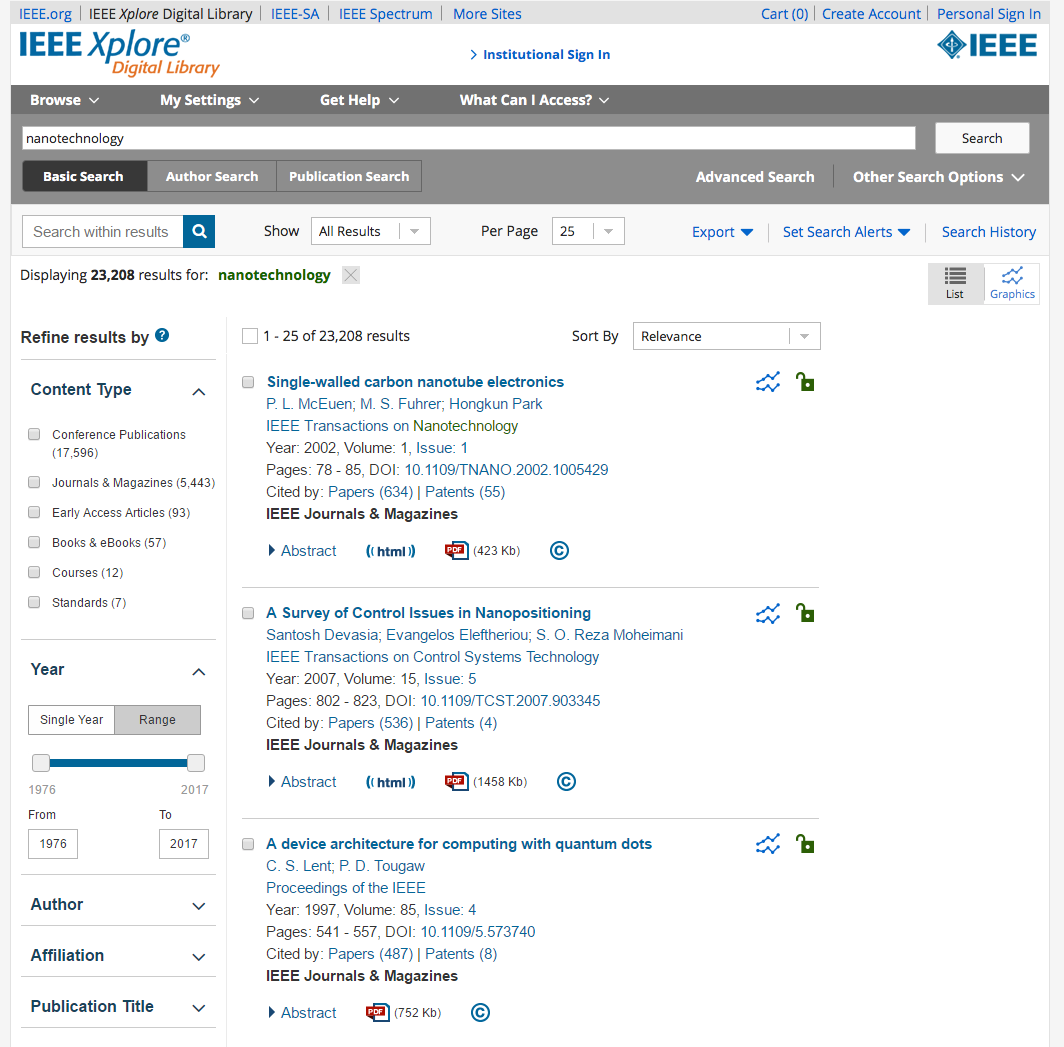
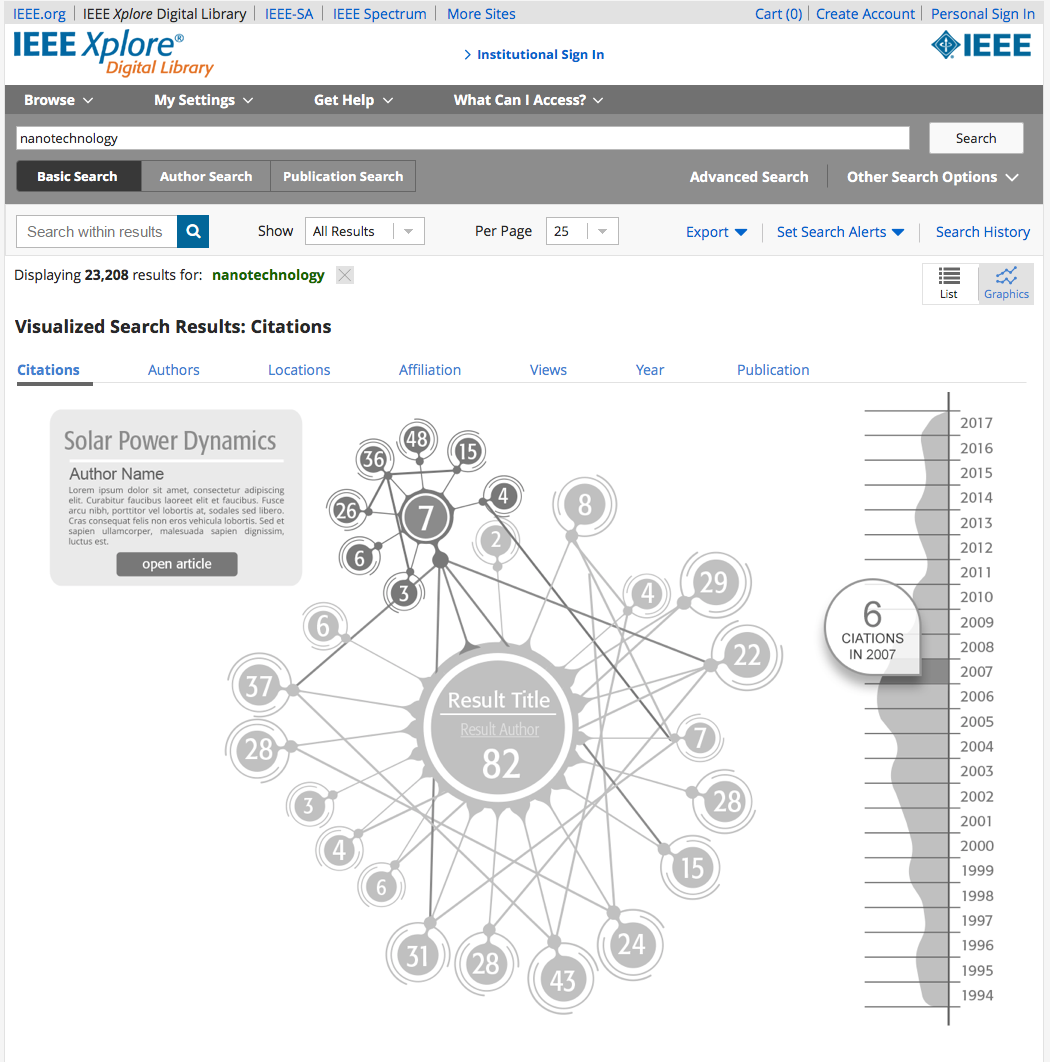
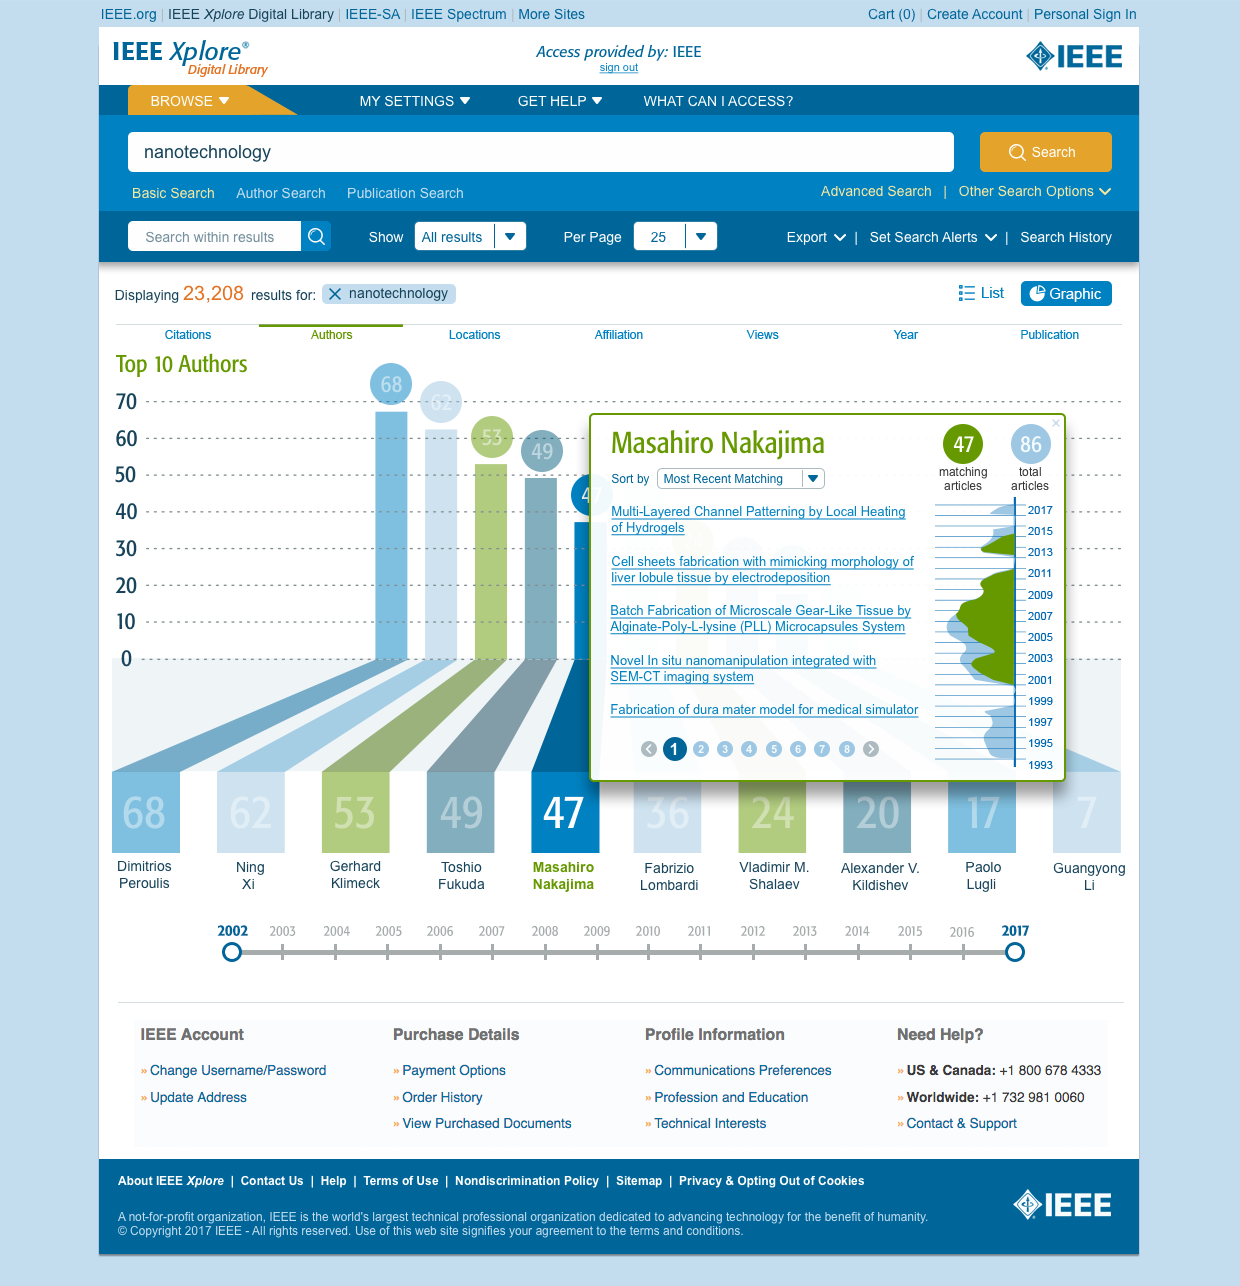
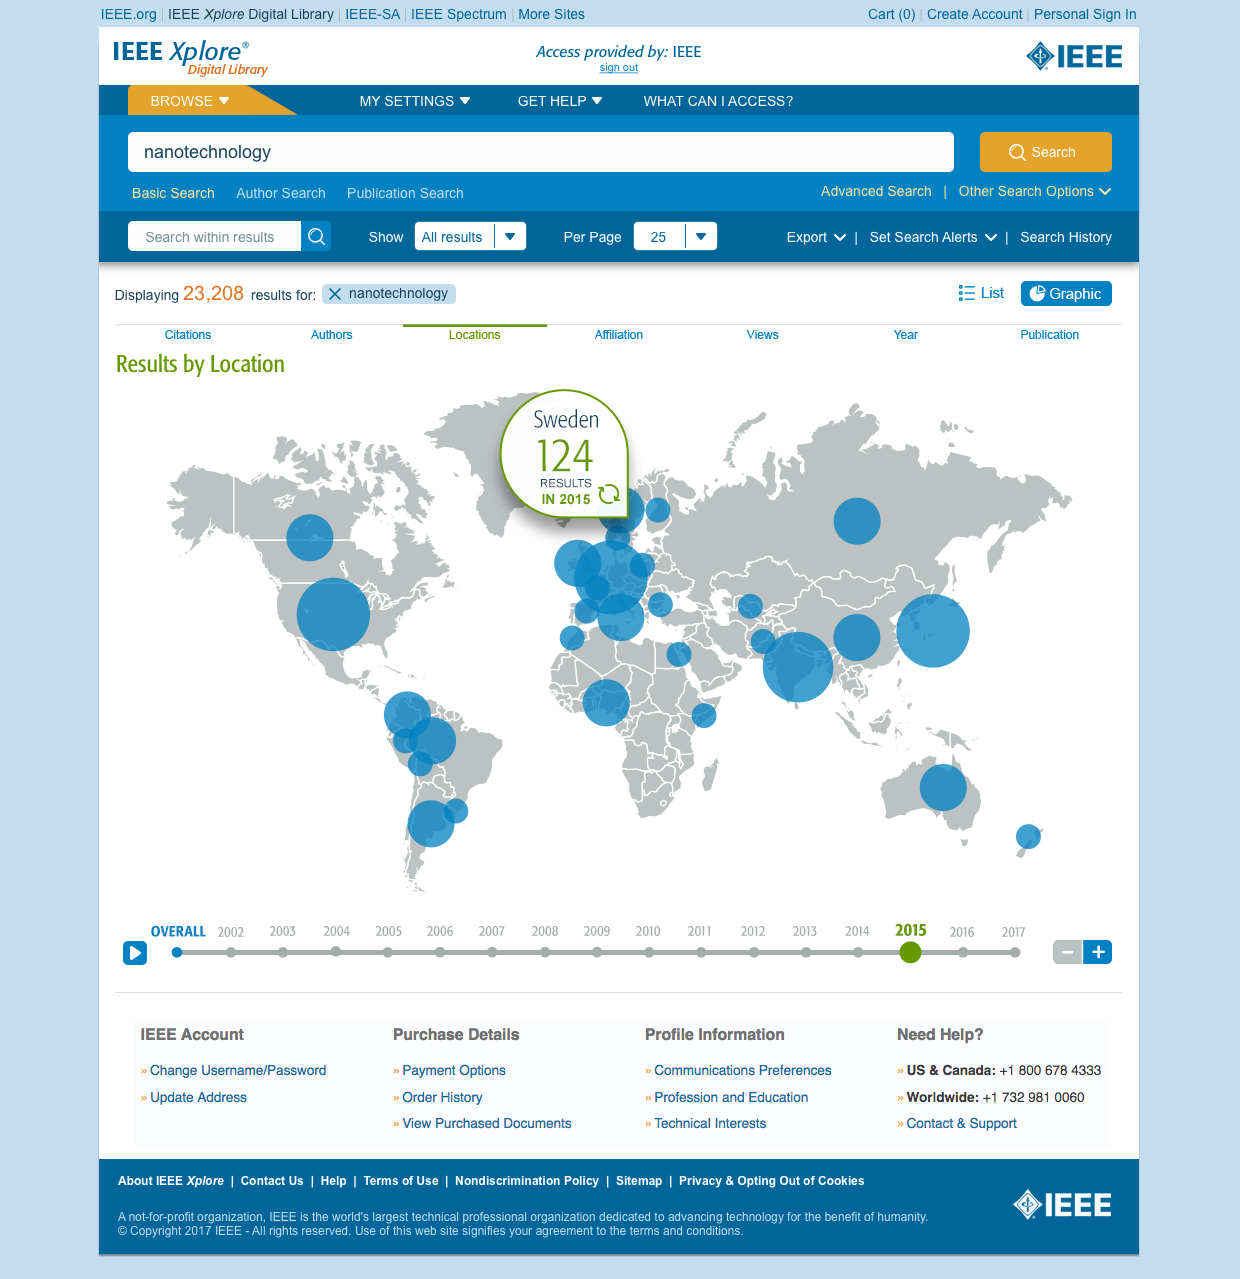
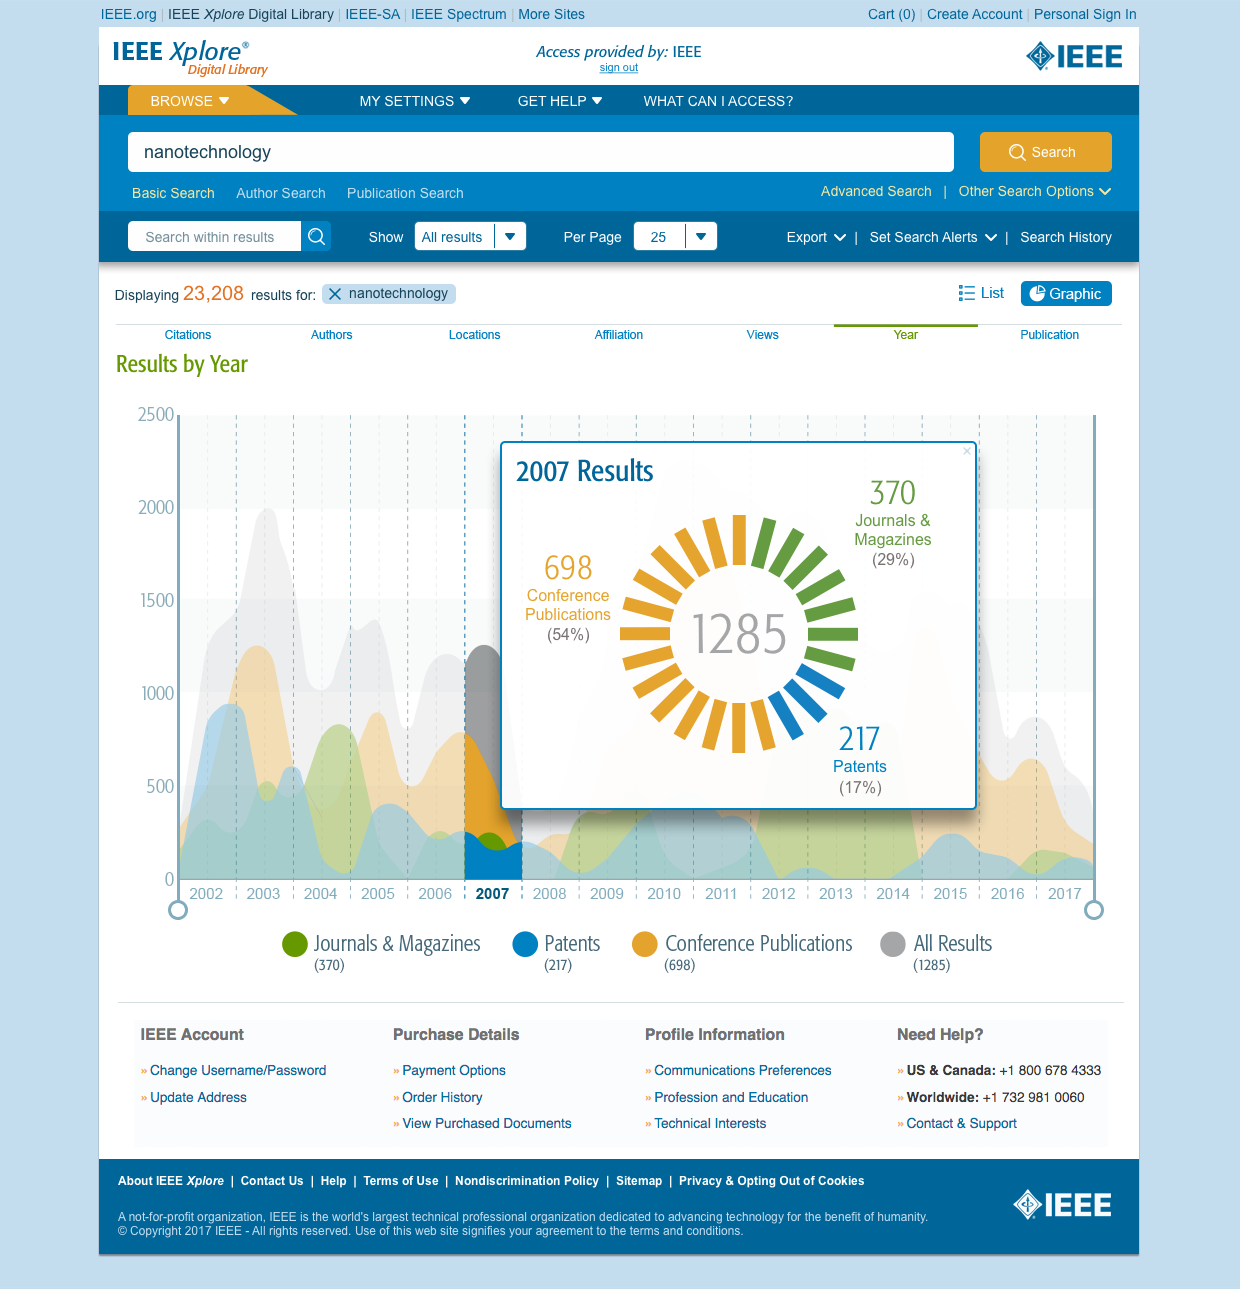
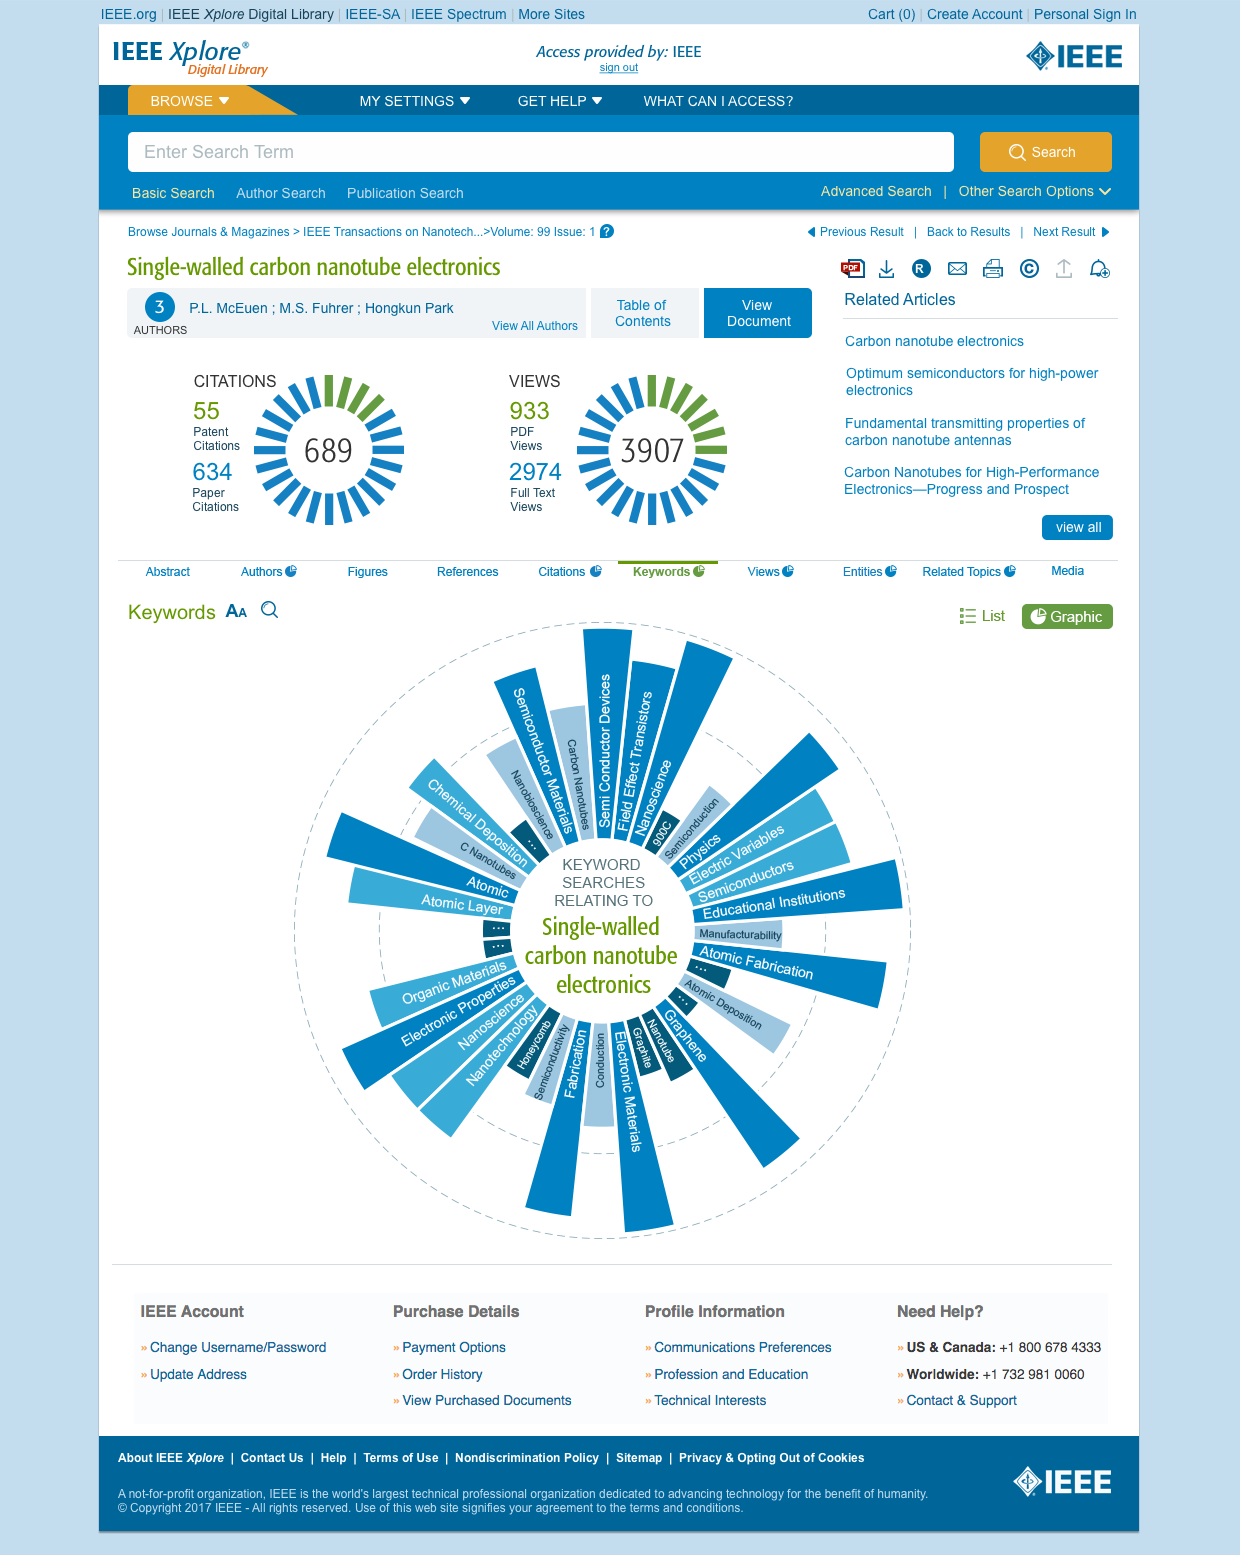
Reimagining an international engineering organization's semantic search engine results to be primarily based in data visualization. Their tool searches and catalogs thousands of journal articles, patent filings, research documents, and other highly technical resources which their huge community of international engineers rely upon to do their jobs. The result of this transformation was a visually stunning collection of interactive data visualizations that enabled users to see connections through contributors, industries, and trends over time and geography. The clients were thrilled with the design work, finding it to be not only useful and usable but visually delightful as well.
Process
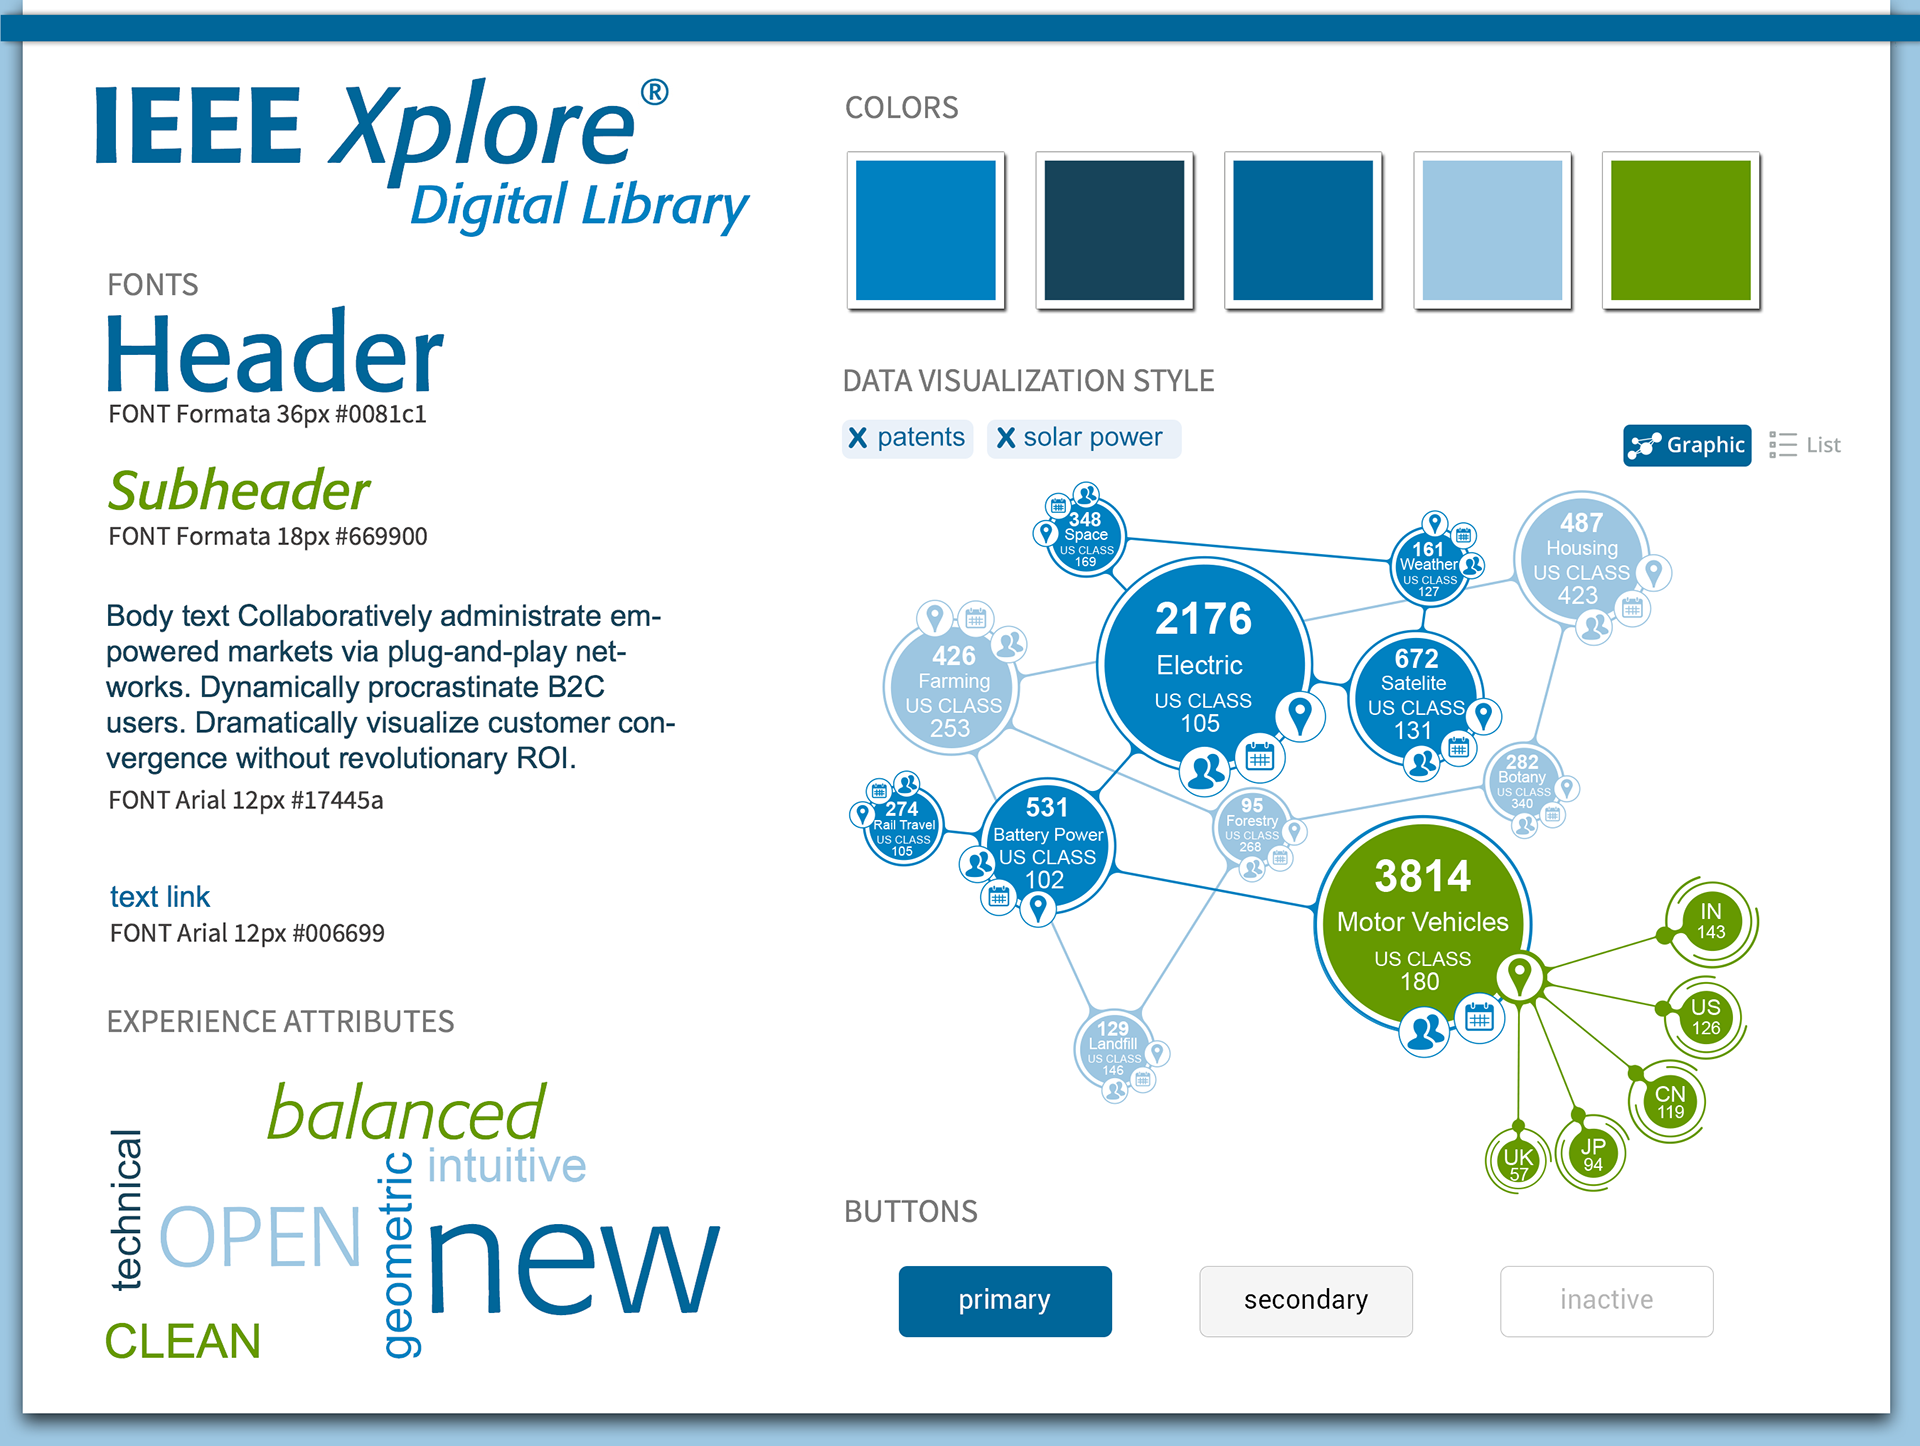
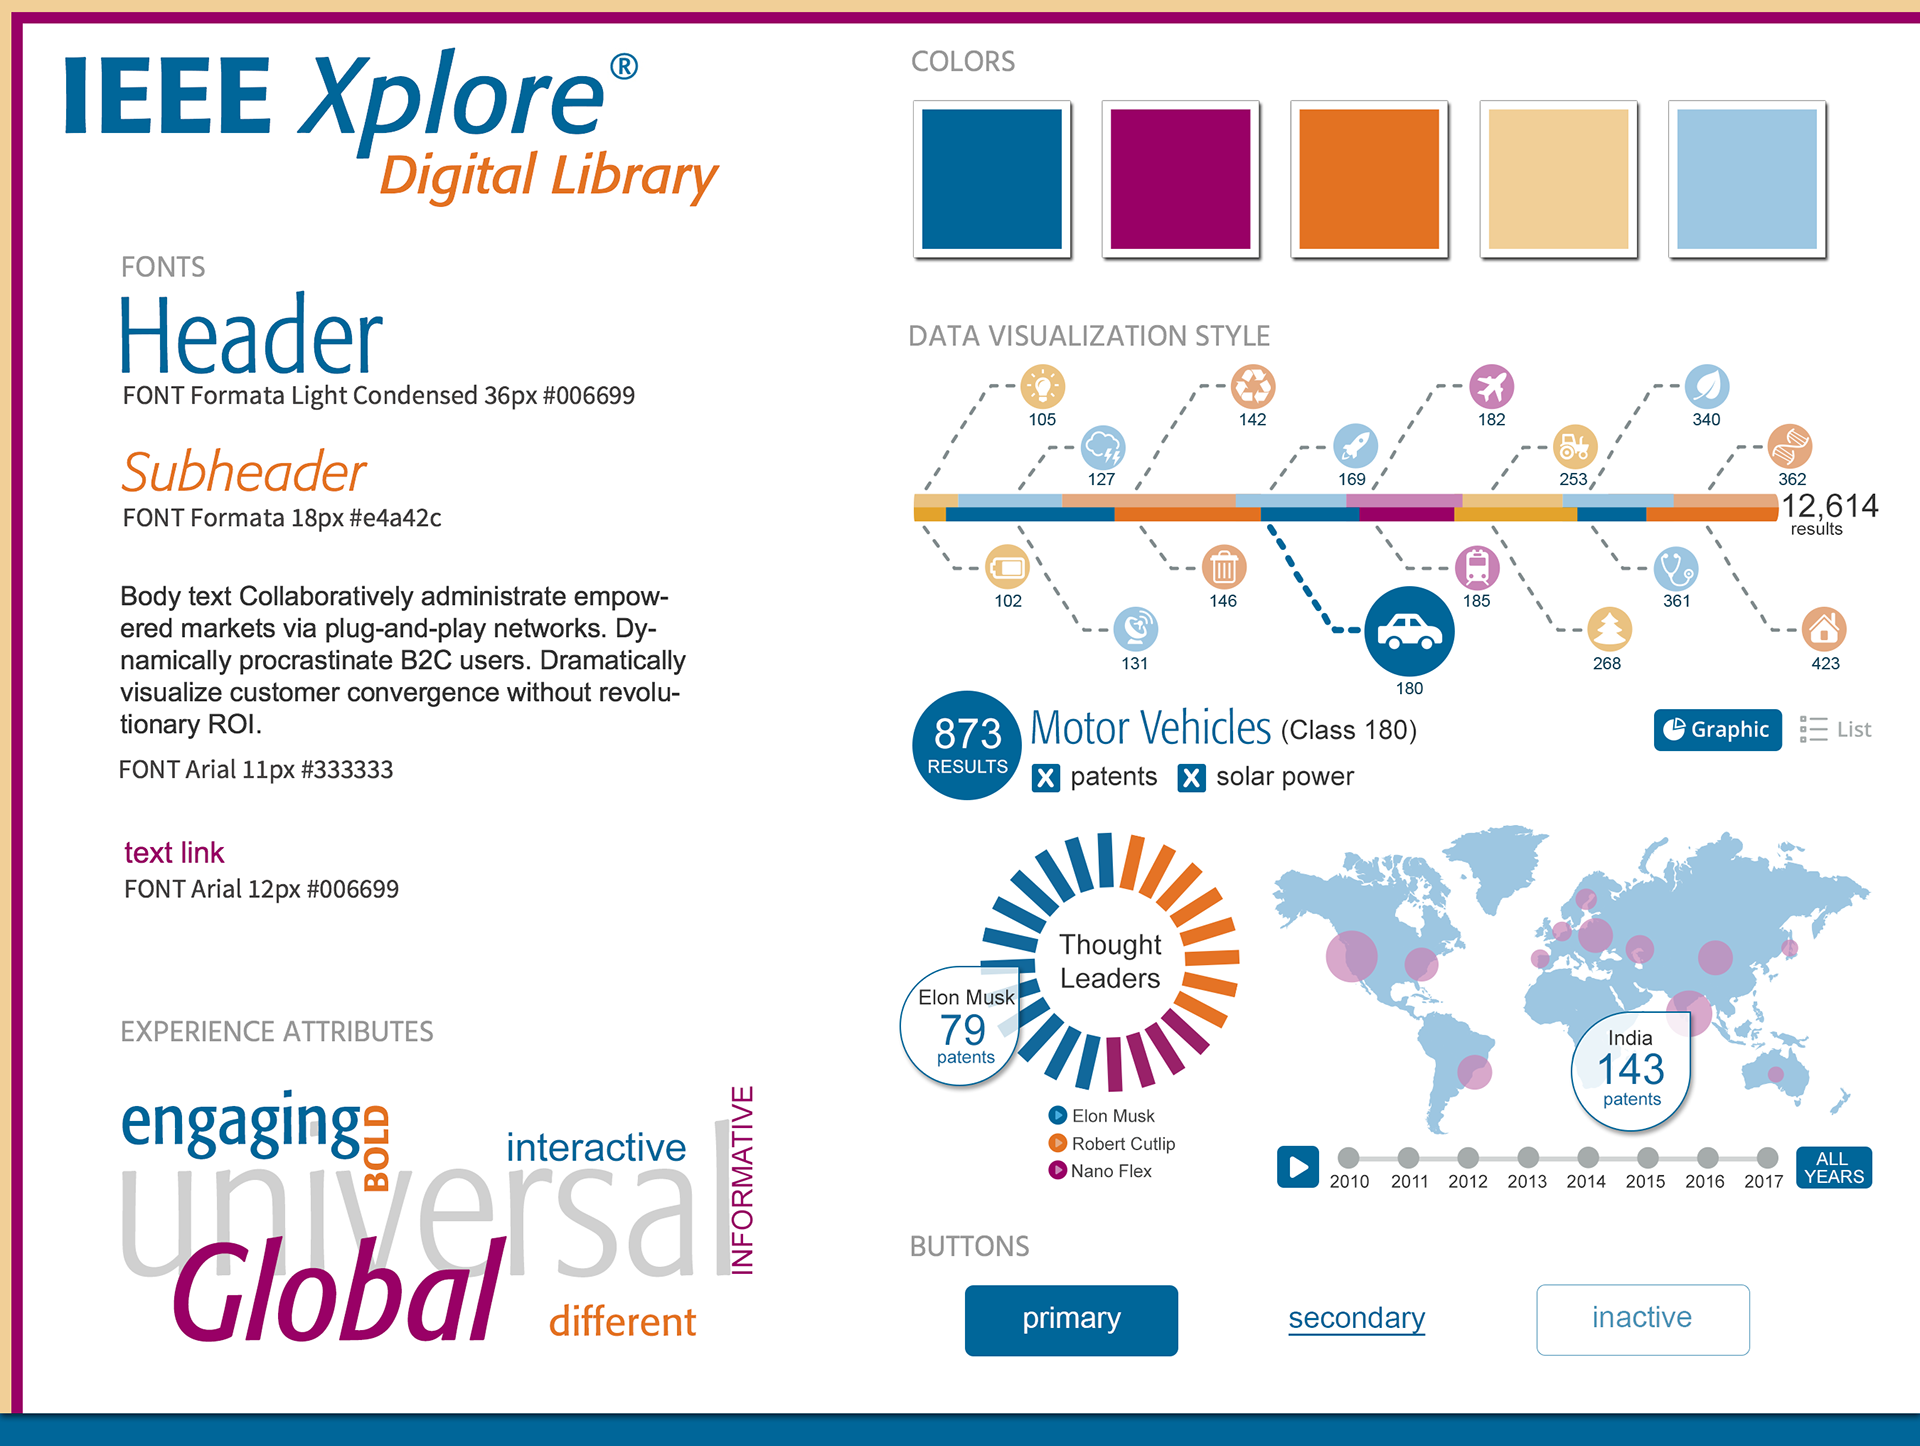
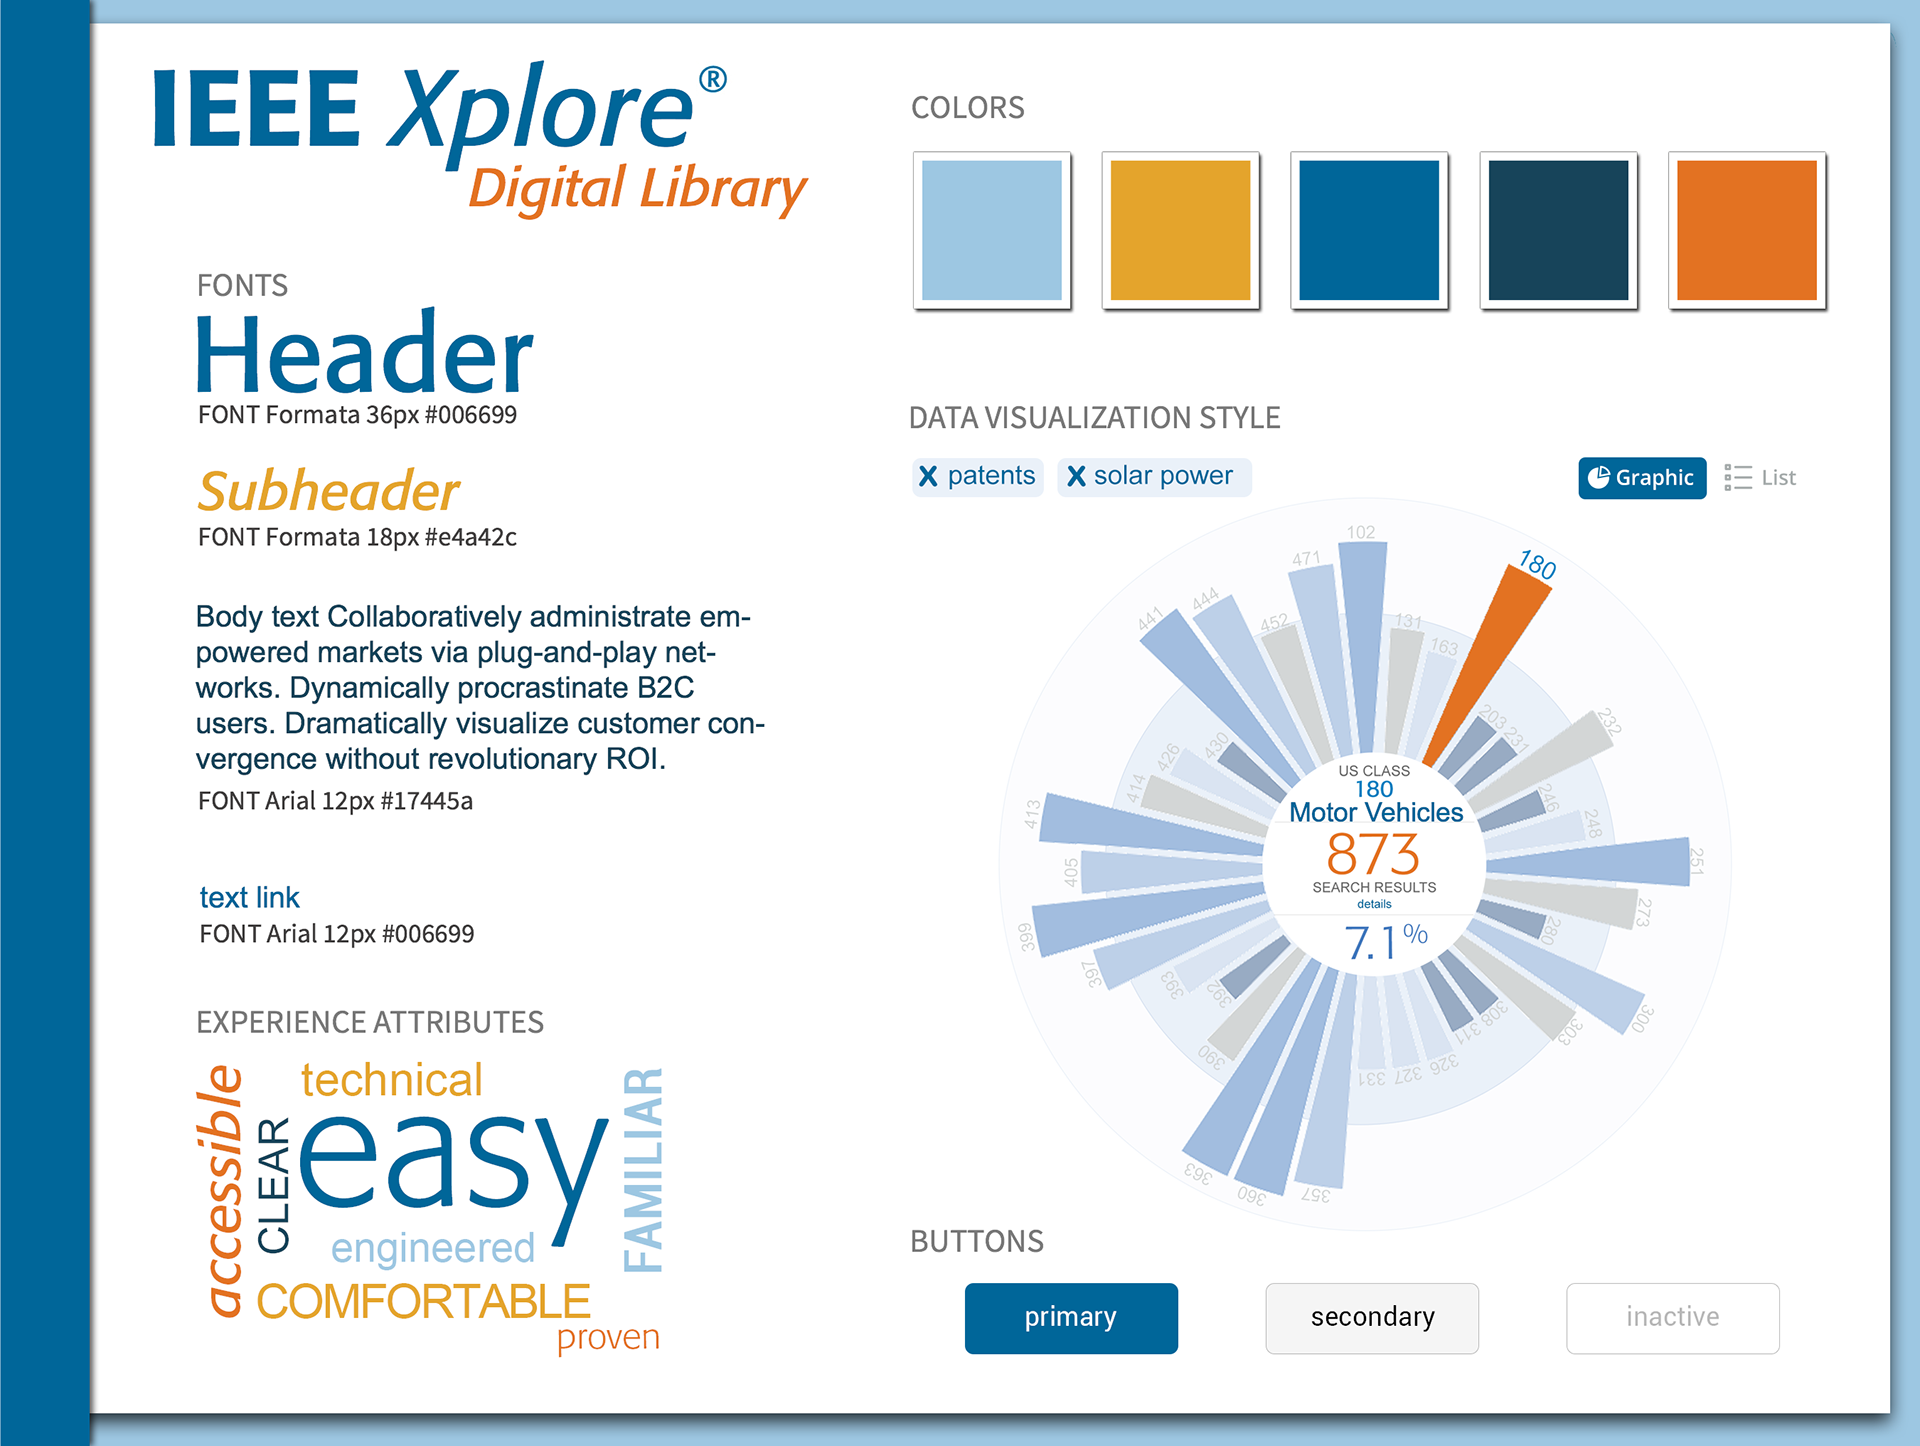
Design Workshop to establish the visual style of the project
User Research - interviewing stakeholders and engineers who use the current product
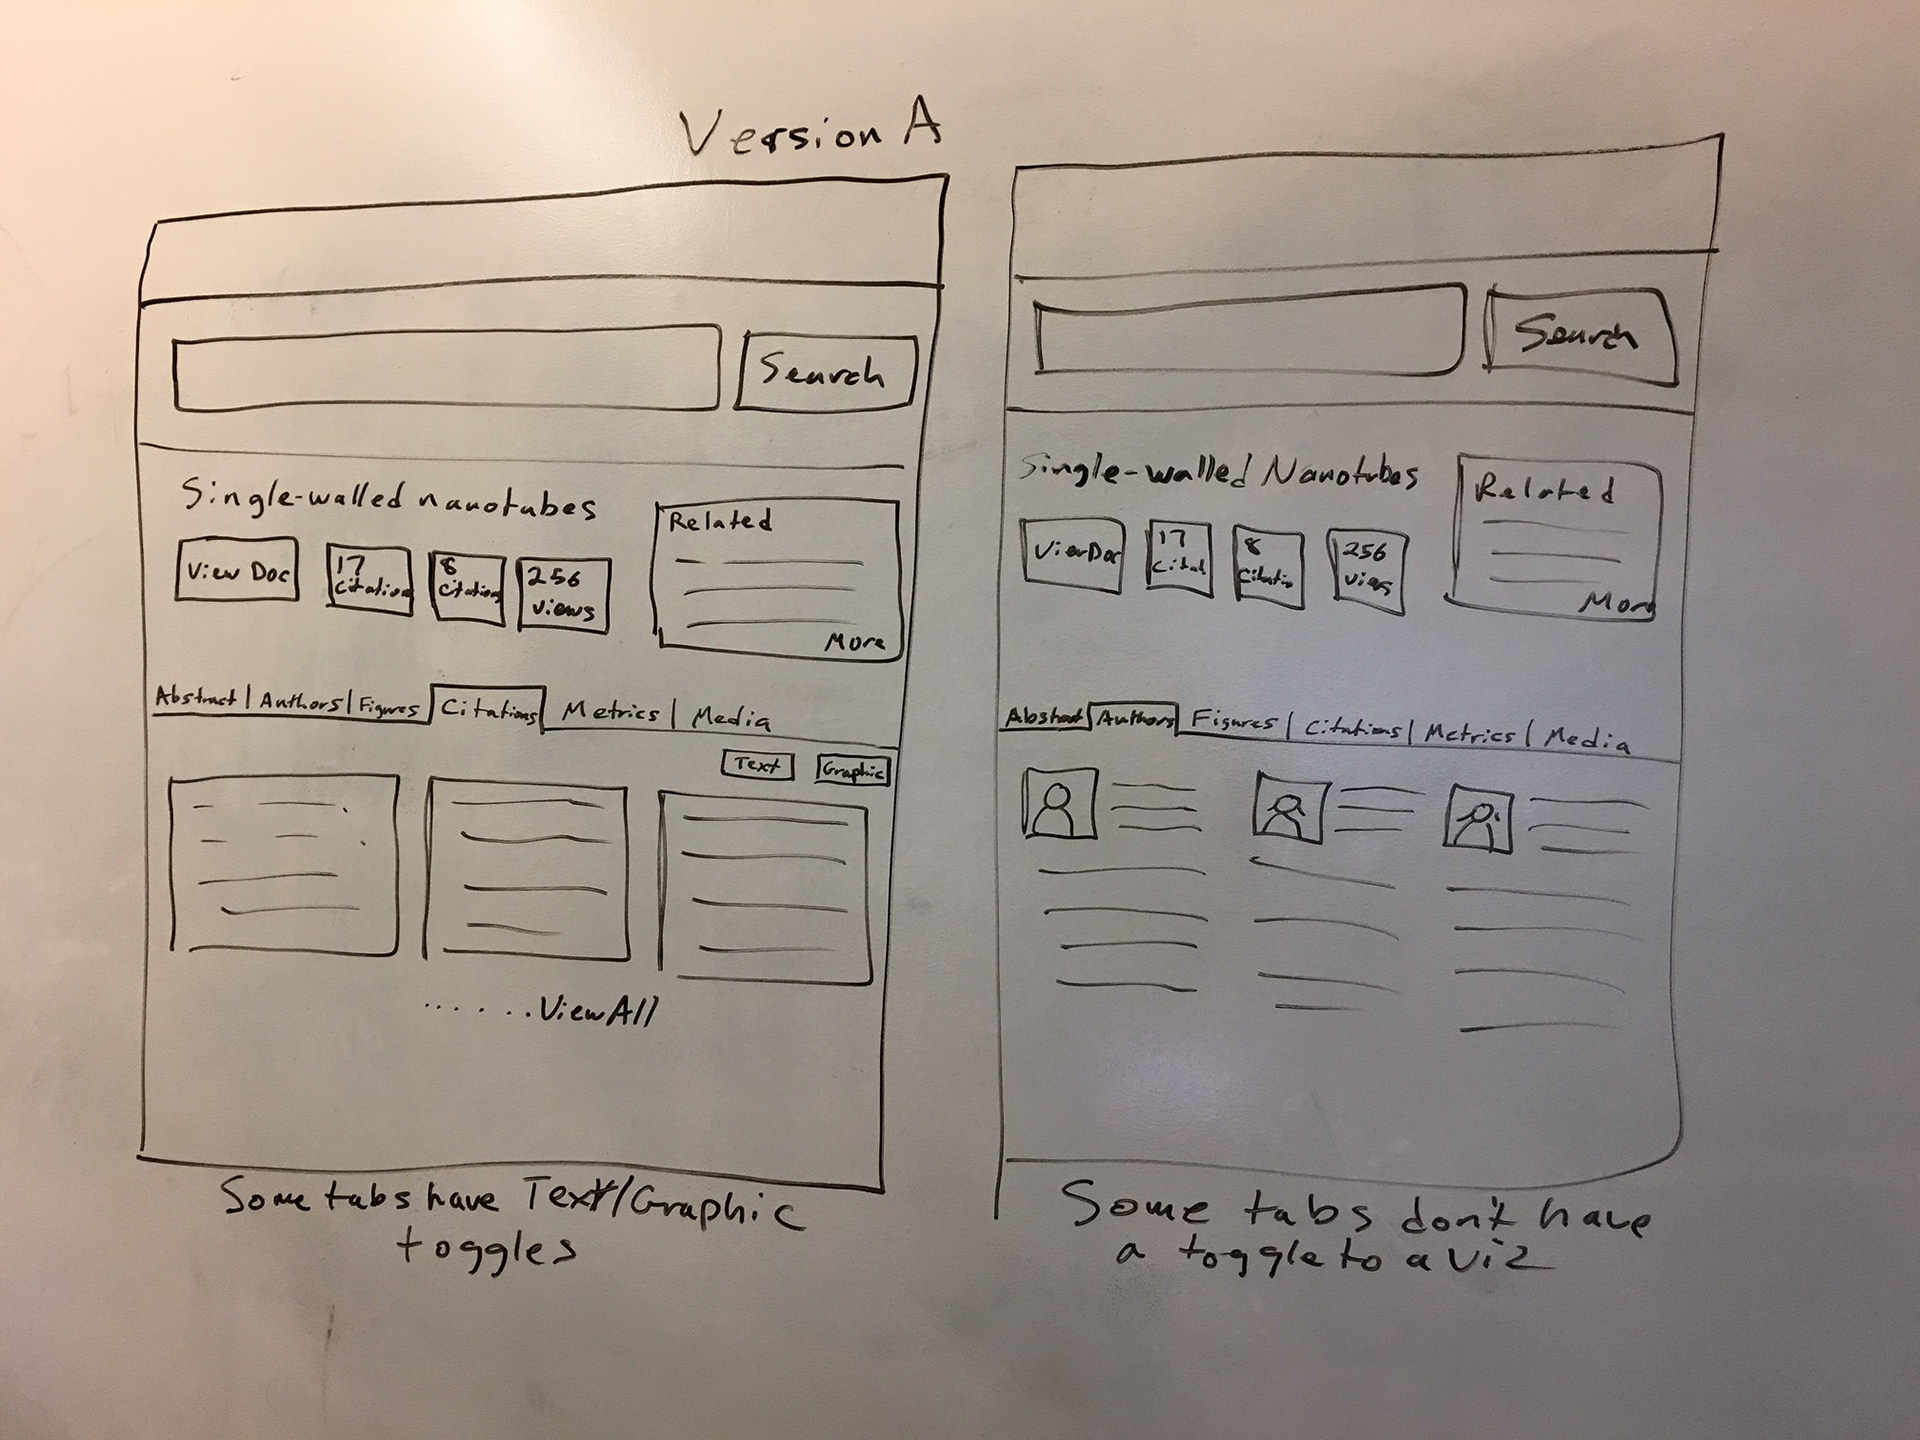
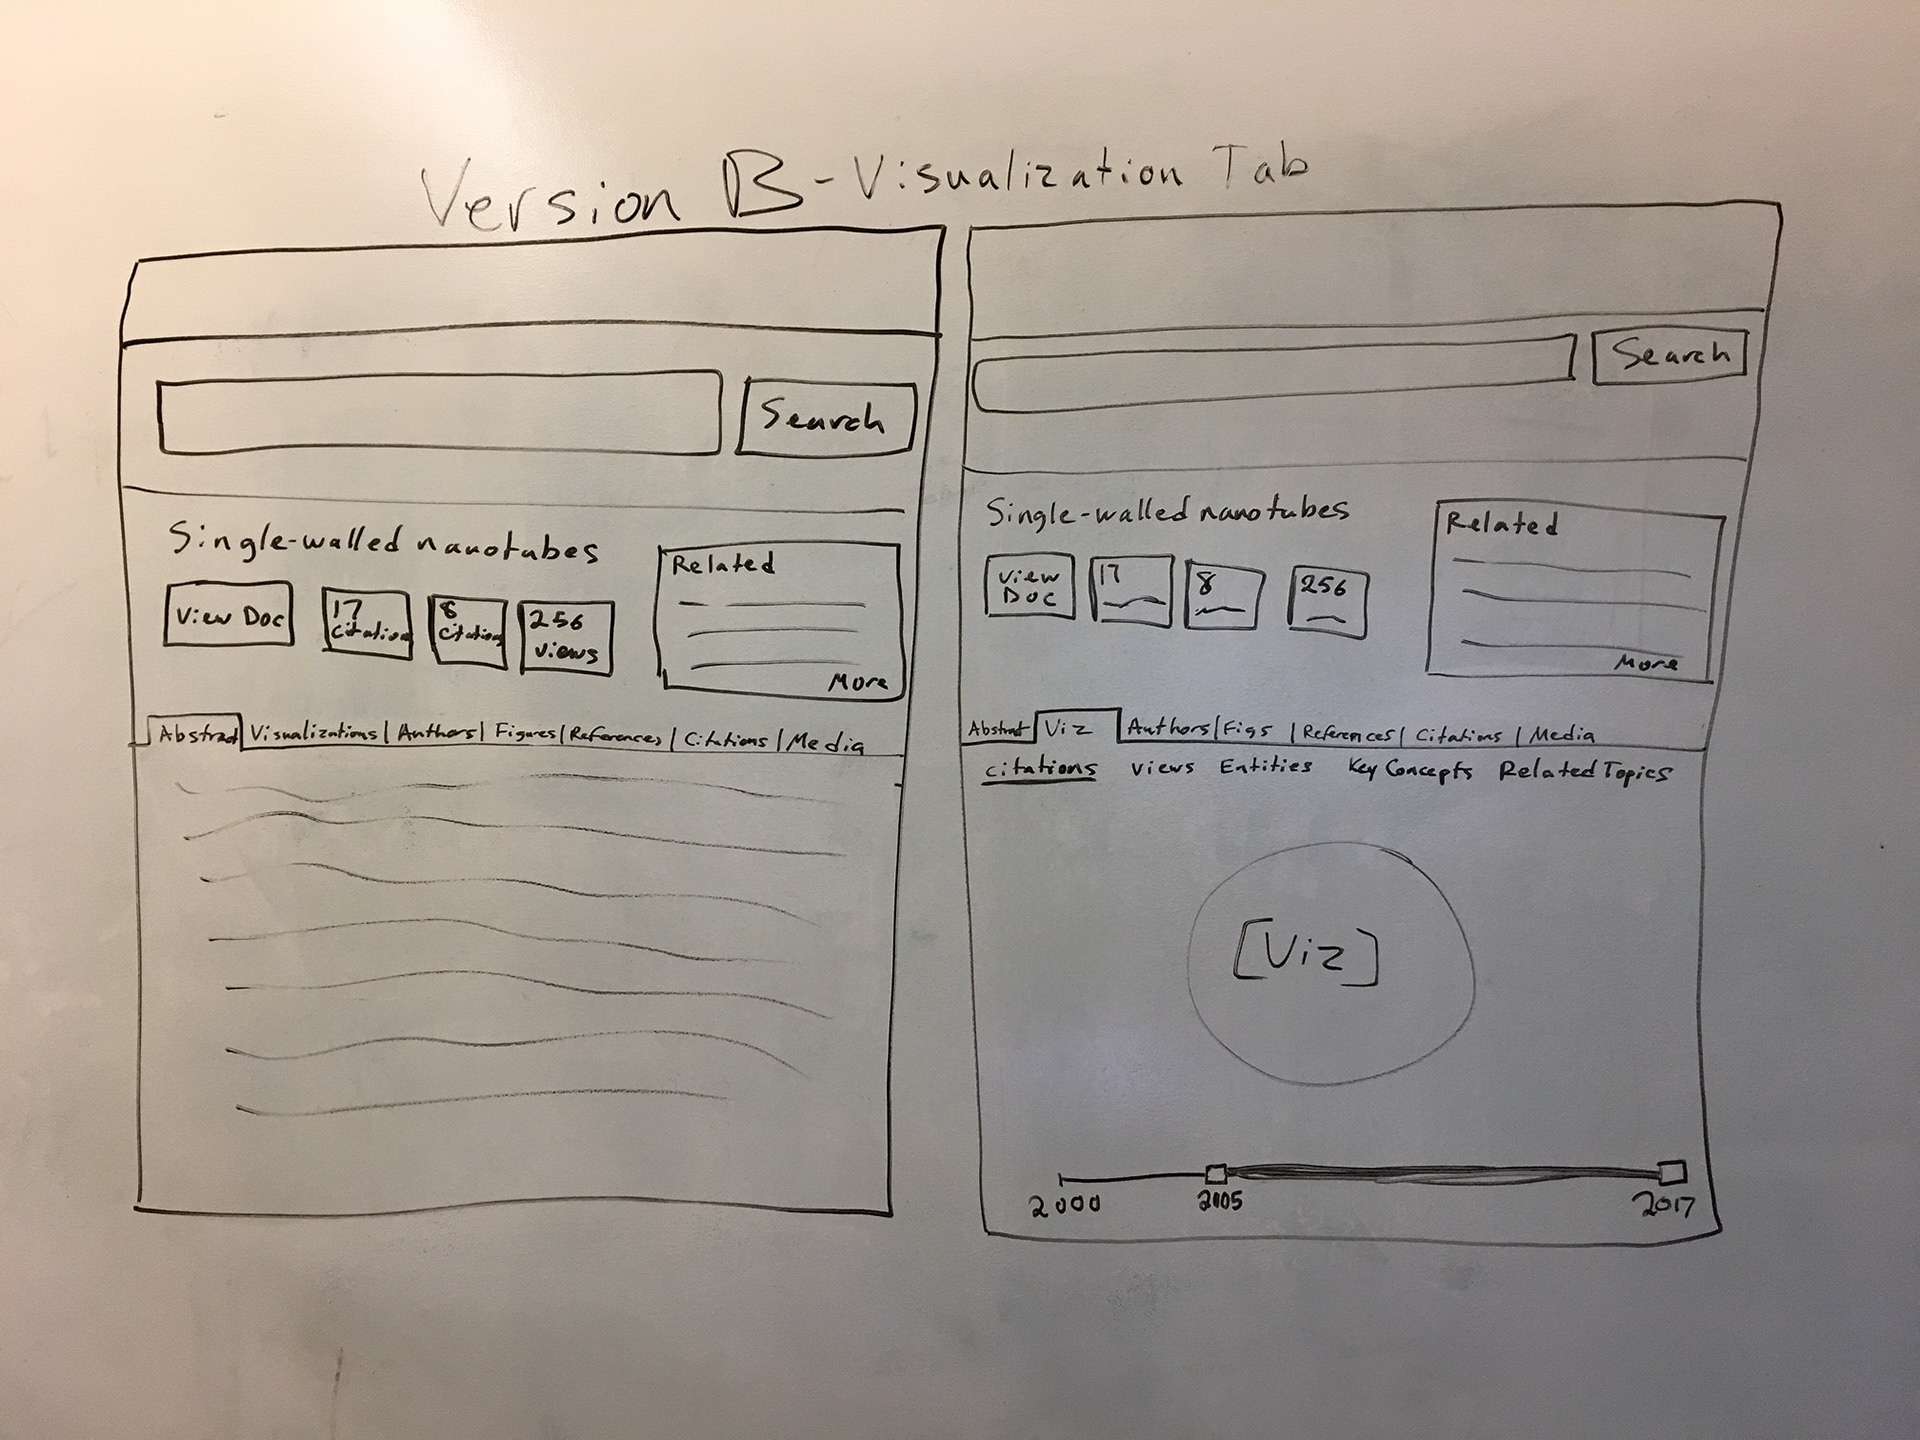
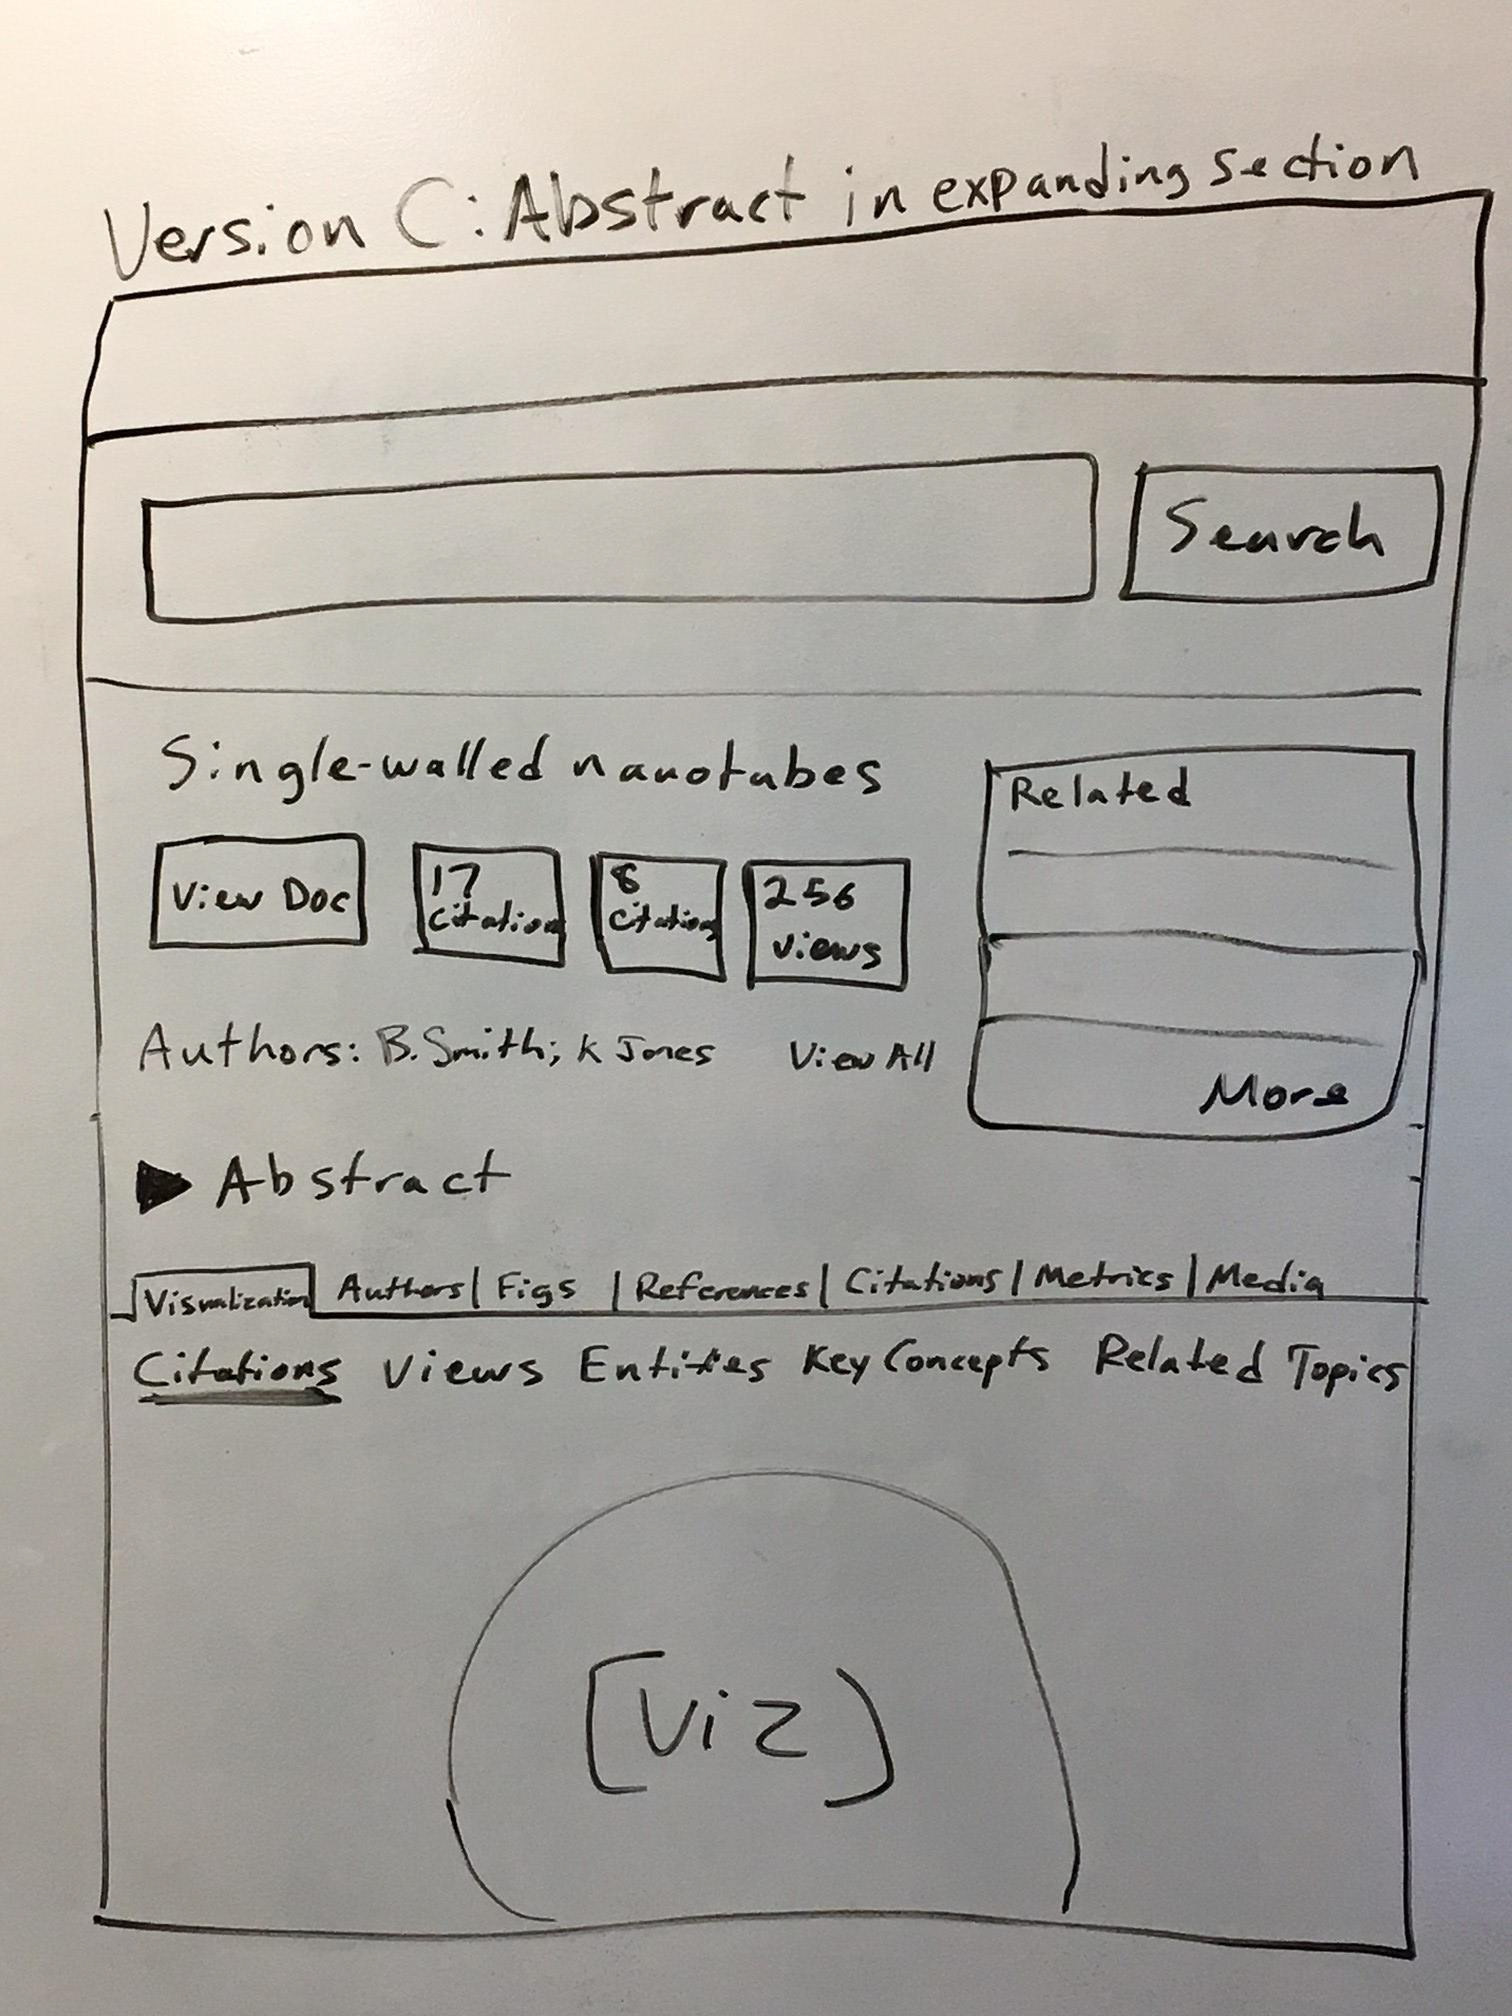
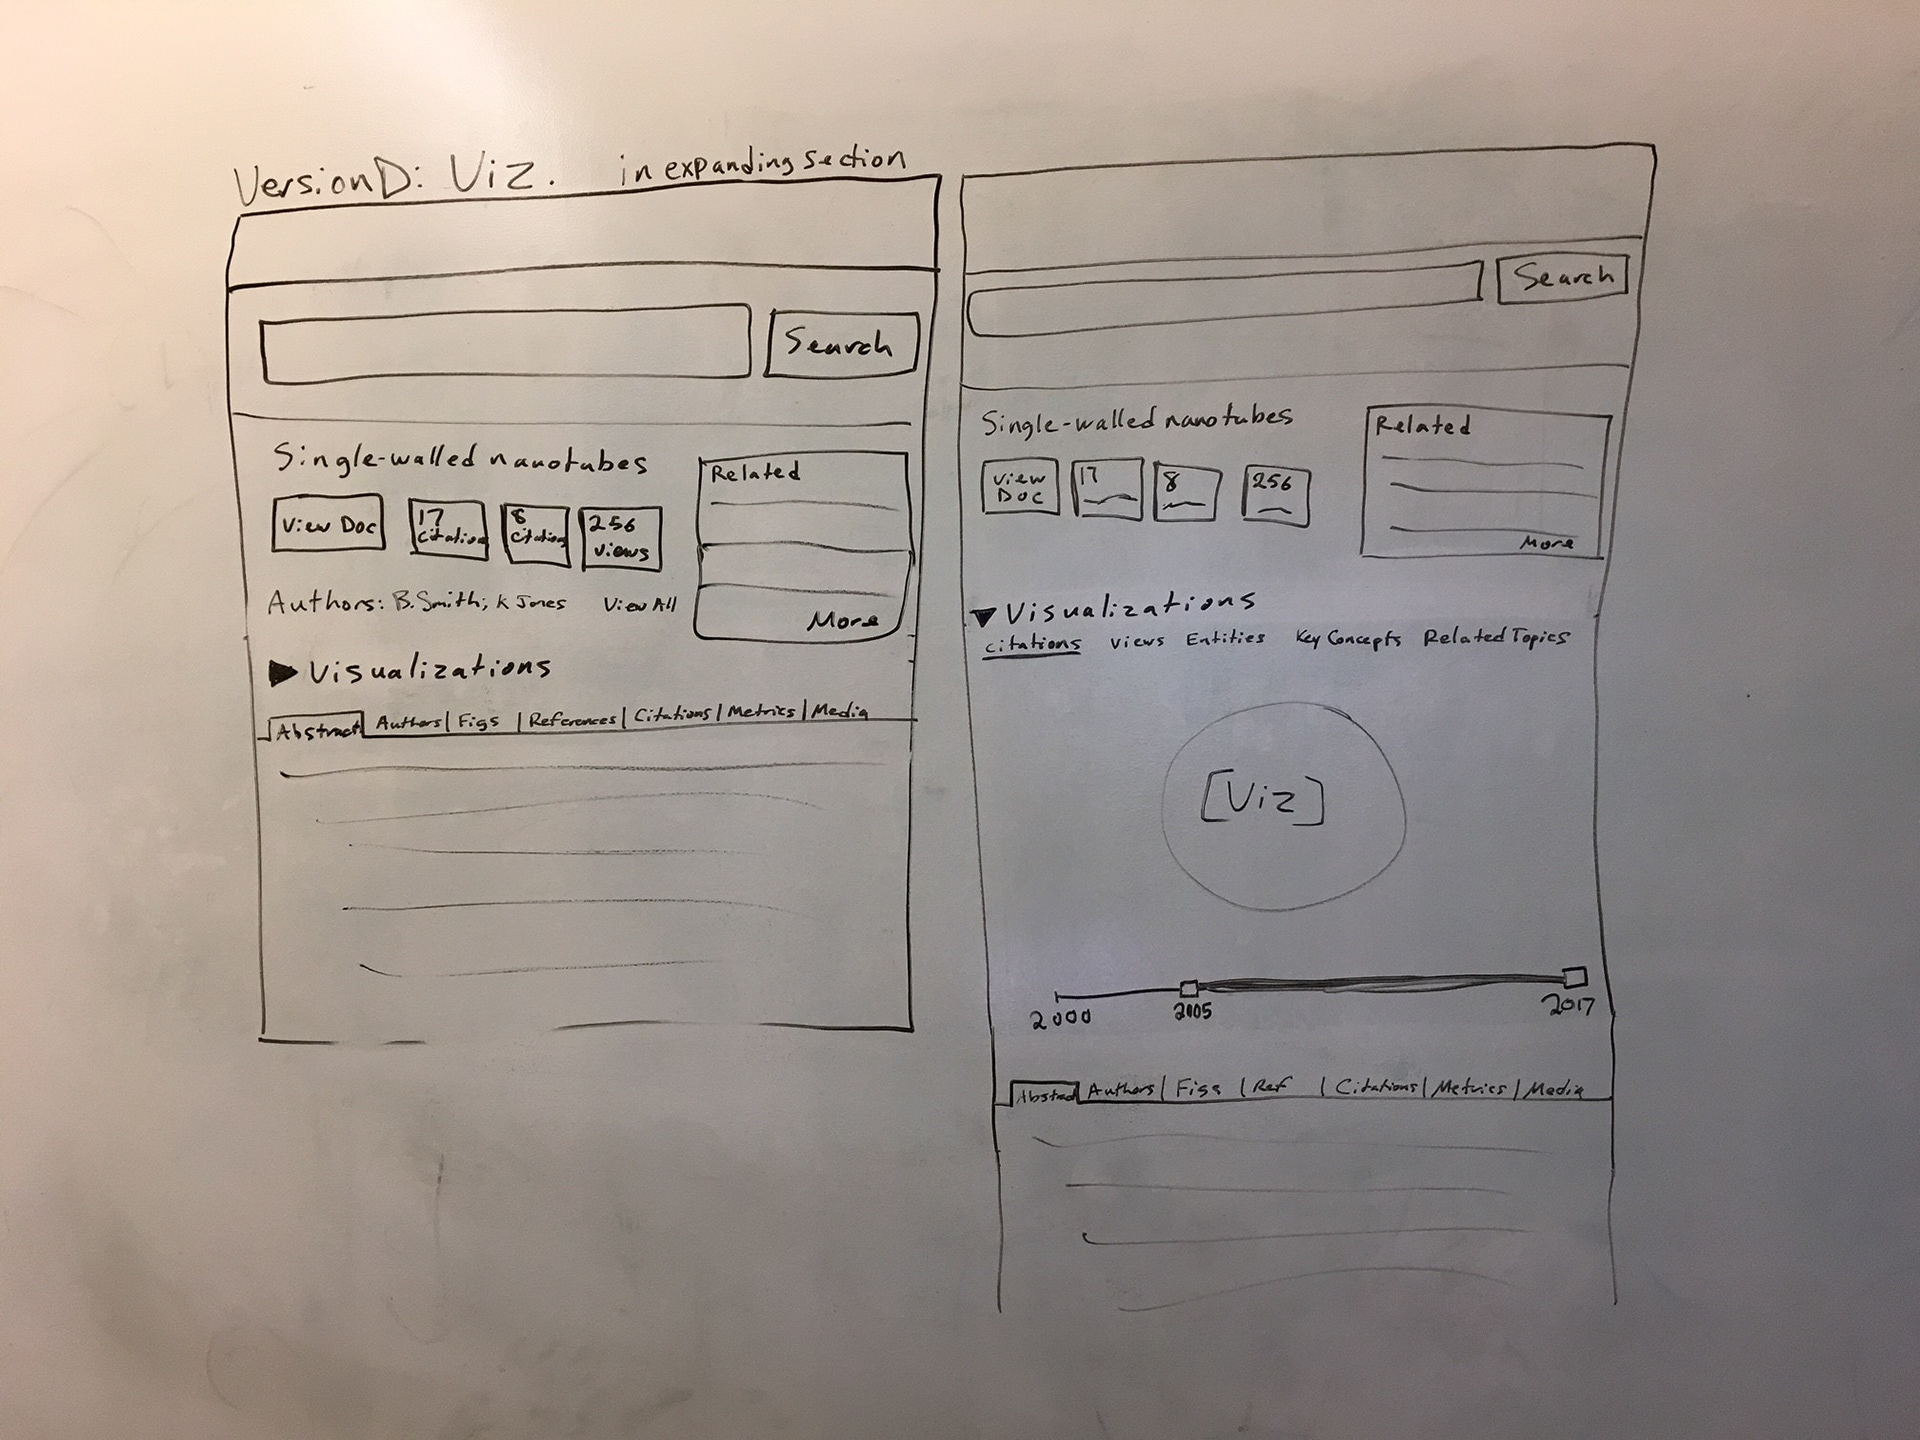
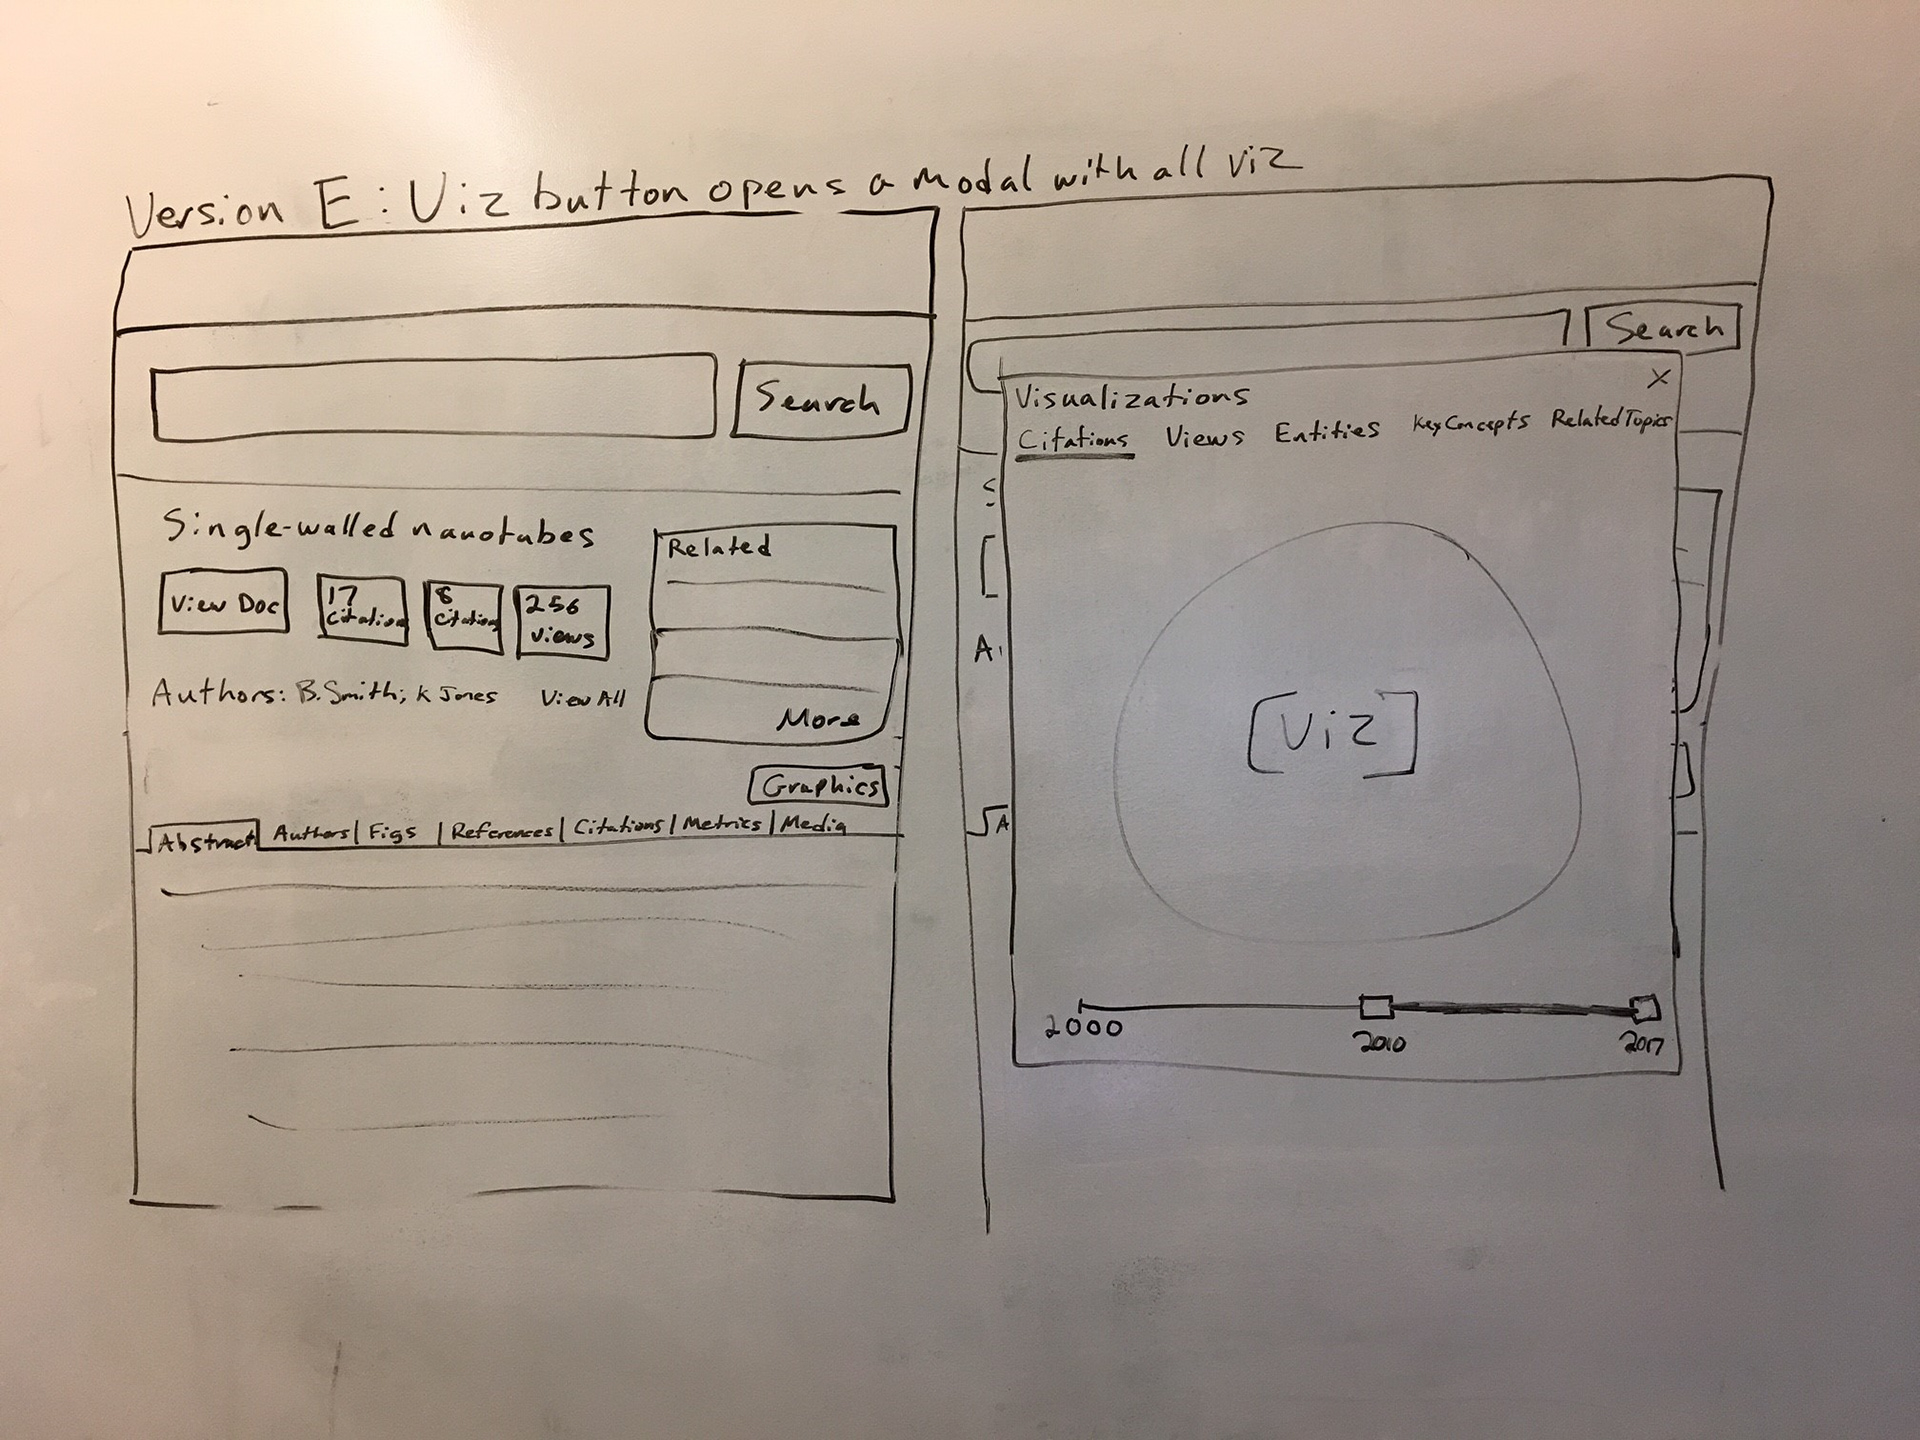
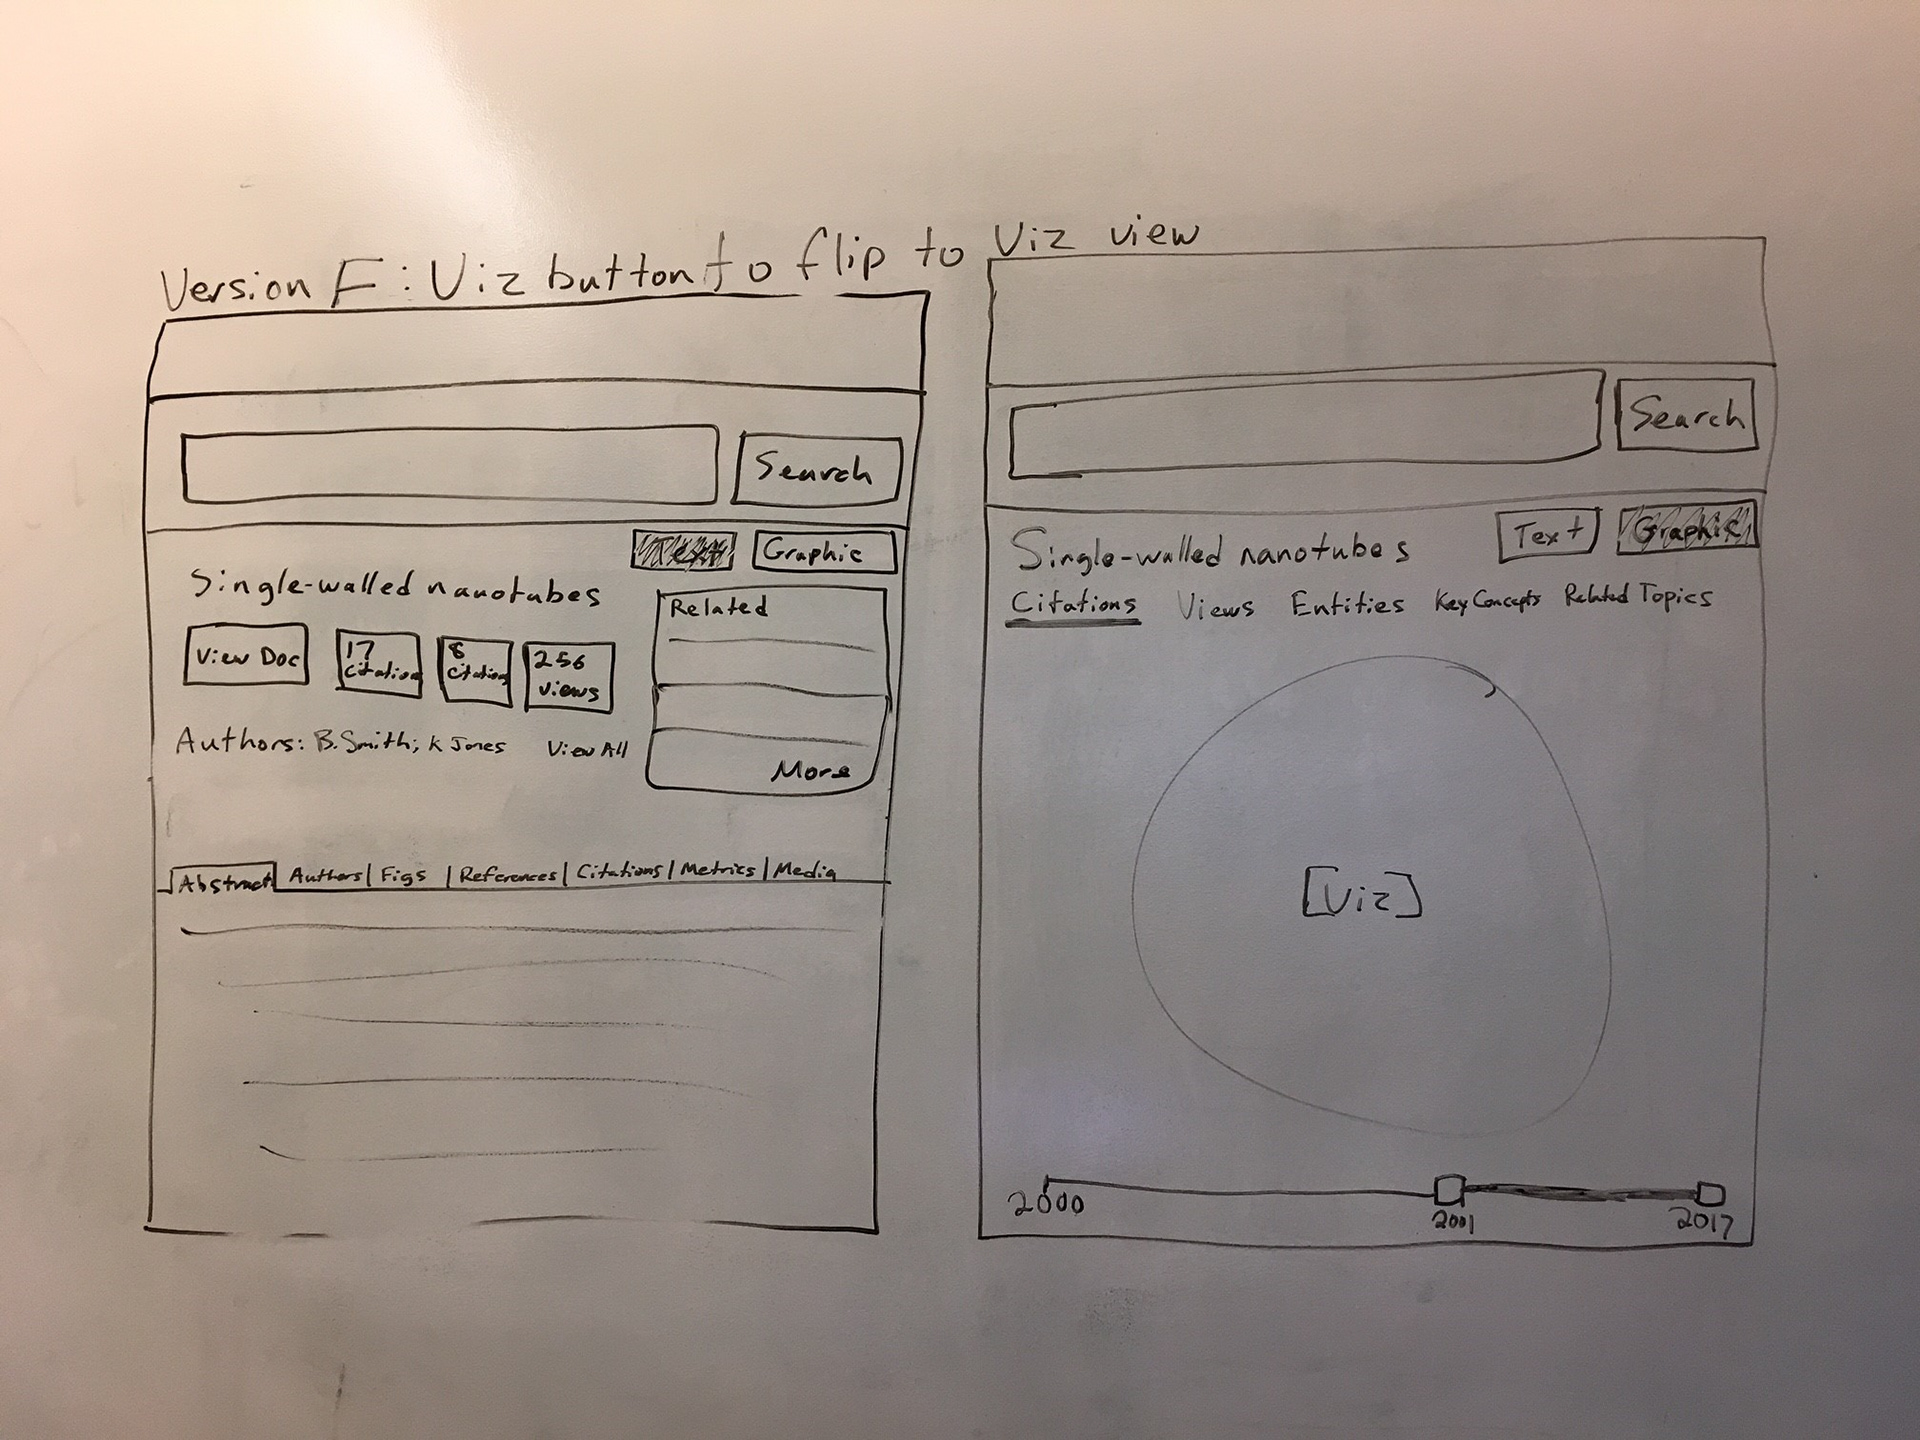
Sketching and Wireframes which quickly transform into rapid prototyping
User Testing of prototypes
Fully visually designed screens with custom data visualizations